








In the previous TechTip, I explained what the Geo Chart API can do in Location Name Mode. Now, I'll discuss this API's GPS Mode and share some insights on the best ways to configure the chart's options.
The previously presented Location Name Mode is very useful when the data that is being presented refers to countries or parts of a country, because the location is not (nor does it intend to be) very accurate. The most accurate way to pinpoint a location using this API is by using that location's GPS coordinates. That's exactly what GPS Mode allows.
As briefly mentioned in the previous TechTip, this mode requires you to indicate the GPS coordinates in order to put the location on the map. However, that's not enough; you have to be able to assign a value and a label to that location. For that, the API has two optional columns that, in my opinion, shouldn't be optional, because the chart simply doesn't make sense without them. So, in total, you have to fill four columns: latitude, longitude, value, and label. Based on this, I've created the template below for this mode (it's the GeoMapGPS.Tmpl file of the GCHARTS/Templates folder):
/$Header
<!DOCTYPE html PUBLIC "-//W3C//DTD XHTML 1.0 Strict//EN" "http://www.w3.org/TR/xhtml1/DTD/xhtml1-strict.dtd">
<html xmlns="http://www.w3.org/1999/xhtml">
<head>
<meta http-equiv="content-type" content="text/html; charset=utf-8" />
<title>/%PageTitle%/</title>
<script src="http://www.google.com/jsapi"></script>
<script>
google.load('visualization', '1', {packages: ['geomap']});
function drawVisualization() {
var data = new google.visualization.DataTable();
data.addRows(/%TotalRows%/);
data.addColumn('number', 'Latitude');
data.addColumn('number', 'Longitude');
data.addColumn('number', '/%ColumnTitle%/');
data.addColumn('string', 'hoovertext');
/$Row
data.setValue(/%RowNbr%/, 0, /%RowLat%/);
data.setValue(/%RowNbr%/, 1, /%RowLng%/);
data.setValue(/%RowNbr%/, 2, /%RowValue%/);
data.setValue(/%RowNbr%/, 3, '/%RowTitle%/');
/$OptionsBegin
var options = {
/$Option
'/%OptionTitle%/': /%OptionValue%/,
/$OptionsEnd
'dataMode': 'Markers'
};
/$Footer
var geomap = new google.visualization.GeoMap(
document.getElementById('visualization'));
geomap.draw(data, options);
}
google.setOnLoadCallback(drawVisualization);
</script>
</head>
<body style="font-family: Arial;border: 0 none;">
<div></div>
</body>
</html>
It's similar to the previous one, even though it's simpler: there are no optional rows or columns, and only the options part is dynamic. Note that the OptionsEnd section has a hardcoded option called 'dataMode': 'Markers'. This is necessary because the GPS Mode requires the API to represent the data in markers instead of regions—the only other possibility and the default value for this option.
The source code itself (please check procedure GenMapGPSChart in QRPGLESRC/GENCHRT source member of the downloadable source code) follows the same line of GenMapChart, but only has a simple string as column title instead of a data structure and, quite the opposite, a complex data structure for the rows. This data structure, P_MapGPSRowDS, will be used to store the previously mentioned four pieces of information of each location (latitude, longitude, value, and label). In order to illustrate the differences between the two modes, I've created the TSTGENMAP3 sample program, which uses the same data as TSTGENMAP2 (from the previous TechTip), but TSTGENMAP3 uses the capital's GPS coordinates instead of the countries, thus producing the chart shown in Figure 1:
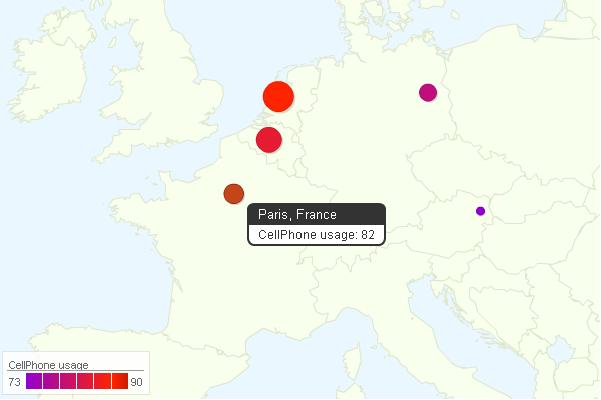
Figure 1: Here are a few of Europe's capitals' cell phone usage, displayed using GPS Mode.
As you might remember, the result of TSTGENMAP2 was this:
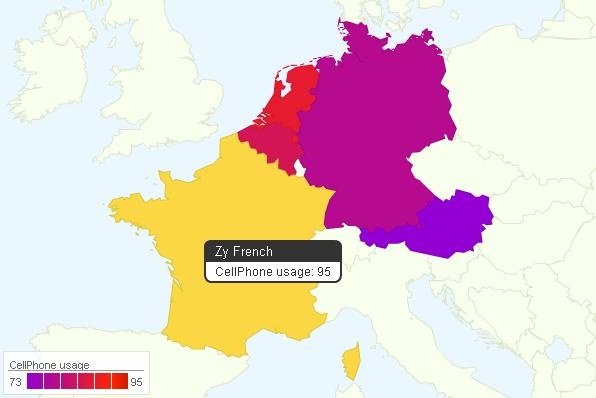
Figure 2: This is the same as before, but using the Location Name Mode.
The lesson here is: if you have just a few values, try to use the Location Name Mode as it will produce a more appealing result. However, if you have a lot of values to include on the chart or the locations are near each other, then go for the GPS Mode. The TSTGENMAP4 sample program uses the information contained in a Los Angeles Times article entitled America's 20 most-visited National Monuments, which discusses the number of visitors to these locations during 2009. Some of the monuments are near each other, and some actually overlap each other (check New York City in Figure 3, for instance).
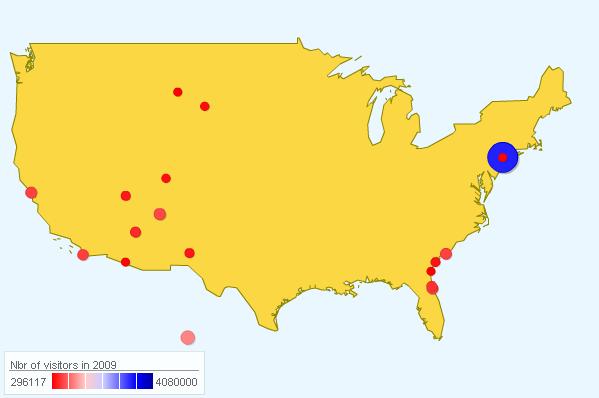
Figure 3: The number of U.S. national monuments visitors in 2009 is shown here
The legend color gradient presented here tried to include the red, white, and blue of the U.S. flag. (Note that the "whitest" on the map is Hawaii, which would have to have a slightly higher value to actually be white.) This was achieved by indicating these three colors in the "colors" option. The hard part is that the colors must be represented in their hexadecimal RGB notation. Well, here's another tip: on this site, you will find not only the main colors but also their variations and the respective notation in Hexadecimal RGB, courtesy and copyright of Mr. Kevin J. Walsh.
The customization that this chart allows goes way beyond changing the legend colors, so be sure to read the documentation and use the Visual Playground provided by Google to experiment.
Here's the complete source code of this TechTip. Feel free to change the templates or build new ones based on mine. If you come up with something brilliant, be sure to let me know!
As you probably noticed by now, Geo Map is a Flash chart generator, which brings some limitations: browser compatibility, performance, and so on. Google recently introduced Geo Chart, which is SVG-based, thus compatible with more browsers. Geo Chart also has more configuration options, but it lacks the GPS Mode. I'll be explaining Geo Chart in a future TechTip of this series, because the next tip will be about another type of chart most chart generators can't provide: the Gauge Chart.

Rafael Victória-Pereira has more than 20 years of IBM i experience as a programmer, analyst, and manager. Over that period, he has been an active voice in the IBM i community, encouraging and helping programmers transition to ILE and free-format RPG. Rafael has written more than 100 technical articles about topics ranging from interfaces (the topic for his first book, Flexible Input, Dazzling Output with IBM i) to modern RPG and SQL in his popular RPG Academy and SQL 101 series on mcpressonline.com and in his books Evolve Your RPG Coding and SQL for IBM i: A Database Modernization Guide. Rafael writes in an easy-to-read, practical style that is highly popular with his audience of IBM technology professionals.
Rafael is the Deputy IT Director - Infrastructures and Services at the Luis Simões Group in Portugal. His areas of expertise include programming in the IBM i native languages (RPG, CL, and DB2 SQL) and in "modern" programming languages, such as Java, C#, and Python, as well as project management and consultancy.
MC Press books written by Rafael Victória-Pereira available now on the MC Press Bookstore.
 |
||
 |
|
Evolve Your RPG Coding: Move from OPM to ILE...and Beyond Transition to modern RPG programming with this step-by-step guide through ILE and free-format RPG, SQL, and modernization techniques. List Price $79.95 Now On Sale
|
|
||
 |
|
Flexible Input, Dazzling Output with IBM i Uncover easier, more flexible ways to get data into your system, plus some methods for exporting and presenting the vital business data it contains. List Price $79.95
Now On Sale
|
|
||
 |
|
SQL for IBM i: A Database Modernization Guide Learn how to use SQL’s capabilities to modernize and enhance your IBM i database. List Price $79.95
Now On Sale
|

 Business users want new applications now. Market and regulatory pressures require faster application updates and delivery into production. Your IBM i developers may be approaching retirement, and you see no sure way to fill their positions with experienced developers. In addition, you may be caught between maintaining your existing applications and the uncertainty of moving to something new.
 IT managers hoping to find new IBM i talent are discovering that the pool of experienced RPG programmers and operators or administrators with intimate knowledge of the operating system and the applications that run on it is small. This begs the question: How will you manage the platform that supports such a big part of your business? This guide offers strategies and software suggestions to help you plan IT staffing and resources and smooth the transition after your AS/400 talent retires. Read on to learn:
LATEST COMMENTS
MC Press Online