








New QTEMP monitoring provides immediate insights for library size and number of objects in those libraries.
With QSystem Monitor version 13, two new options have been added to the PC user interface that allow users to monitor the count of objects in QTEMP libraries and the size of QTEMP libraries. These monitors provide immediate identification of hidden disk use and are invaluable in detecting situations in which jobs or applications may impact auxiliary storage by looping and filling up QTEMP libraries.
You can use the new monitors along with the Show Details feature for instant insight into the number of objects currently in QTEMP and their associated jobs. Objects can be shown in ascending or descending order, according to their size, which helps you quickly isolate standout large objects or smaller groups of objects collectively contributing to a larger overall figure. You can even assign thresholds and alerts for proactive responses to any issue that is detected.
Monitor QTEMP Count
This option allows the user to monitor for the number of objects within the QTEMP libraries of jobs in the nominated subsystem. The operating system maintains a separate QTEMP library for each active job. An example configuration is shown in Figure 1:
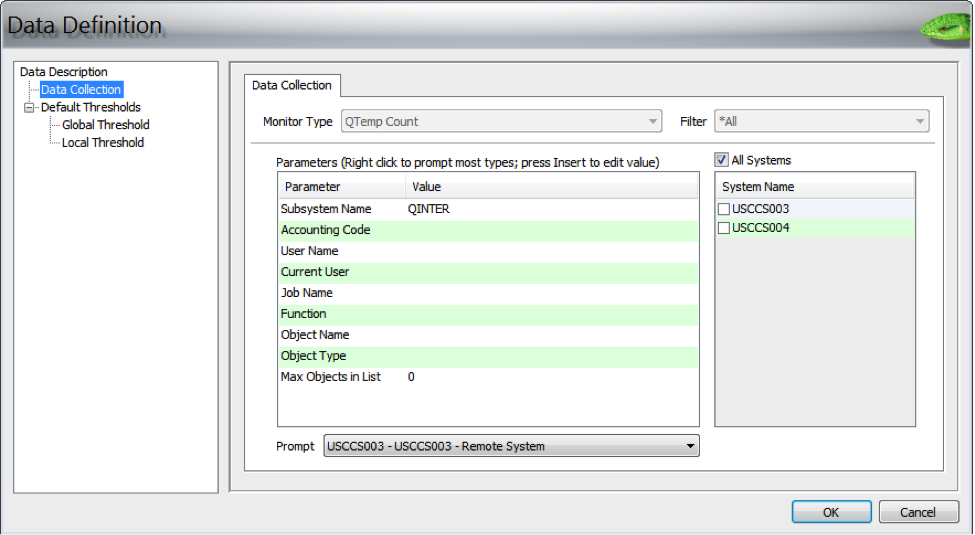
Figure 1: The Data Definition screen shows QTEMP count configuration.
Note the parameters are a combination of job selection (subsystem name, job name, etc.) and object selection (name and type) parameters. This check returns the following:
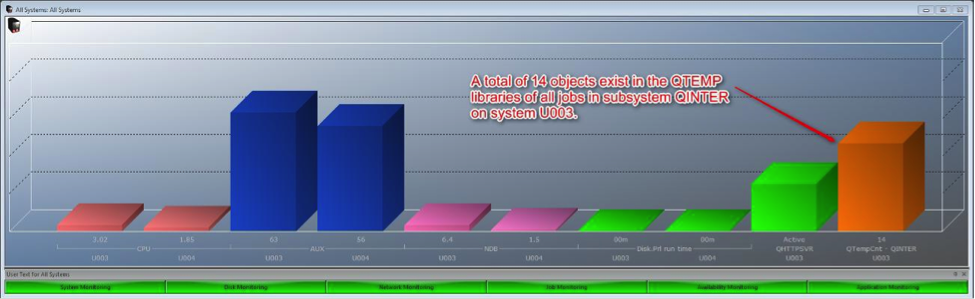
Figure 2: The Online Monitor shows a real-time view of the QTEMP object count.
If we right-click on the bar and select the Show Details option, we can view all the jobs that are attributing to this value:
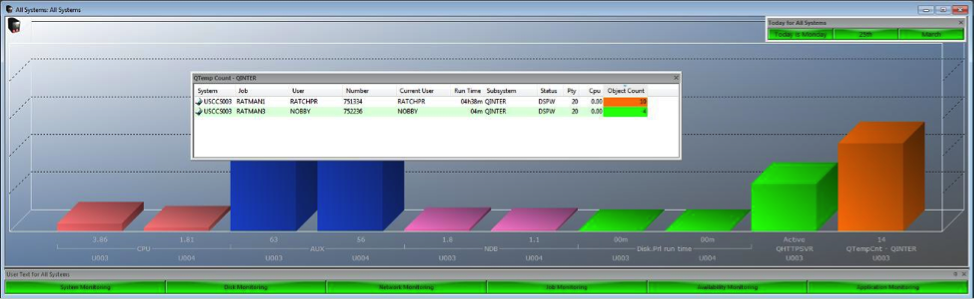
Figure 3: Using the Show Details feature, a new screen displays the breakdown of QTEMP objects.
Monitor QTEMP Size
This option allows the user to monitor for the size of selected objects within the QTEMP libraries of jobs in the nominated subsystem. An example is shown below:
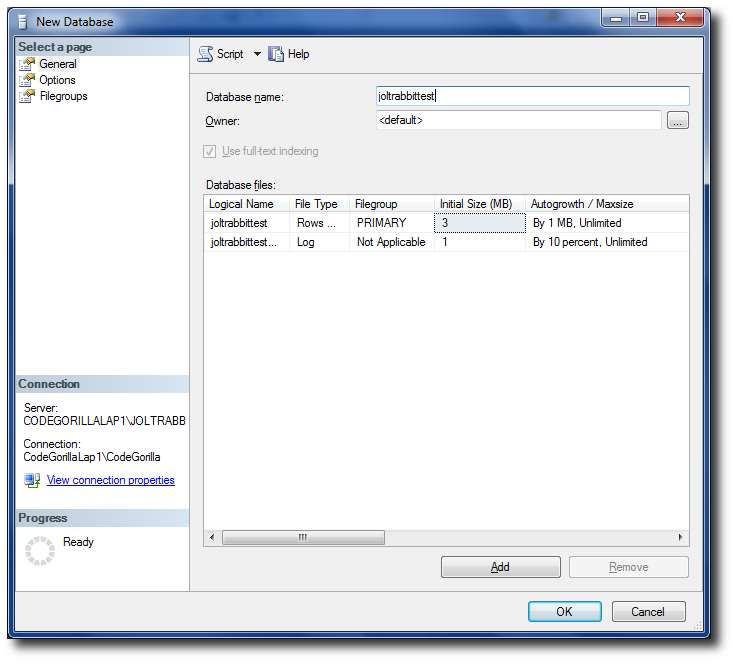
Figure 4: The Data Definition screen shows QTEMP size configuration.
This check returns the following:
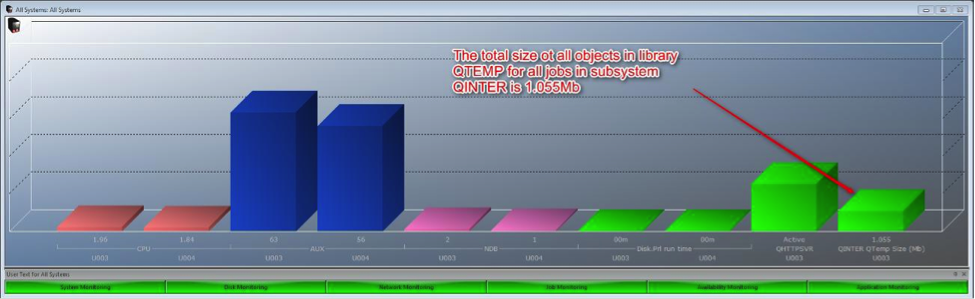
Figure 5: The Online Monitor shows a real-time view of the QTEMP size.
If we right-click on the bar and select the Show Details option, we can view all the jobs that are attributing to this value:
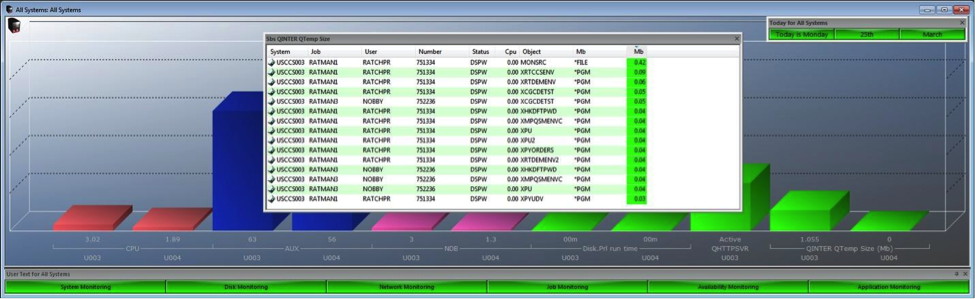
Figure 6: Using the Show Details feature, a new screen displays the breakdown of QTEMP objects by size.
If you're having trouble identifying the cause of seemingly unknown disk usage or if you're experiencing known issues with QTEMP, contact us at www.ccssltd.com. Our experts can guide you through the new QTEMP features and demonstrate how they can be applied to resolve your real-world challenges.

 Business users want new applications now. Market and regulatory pressures require faster application updates and delivery into production. Your IBM i developers may be approaching retirement, and you see no sure way to fill their positions with experienced developers. In addition, you may be caught between maintaining your existing applications and the uncertainty of moving to something new.
 IT managers hoping to find new IBM i talent are discovering that the pool of experienced RPG programmers and operators or administrators with intimate knowledge of the operating system and the applications that run on it is small. This begs the question: How will you manage the platform that supports such a big part of your business? This guide offers strategies and software suggestions to help you plan IT staffing and resources and smooth the transition after your AS/400 talent retires. Read on to learn:
LATEST COMMENTS
MC Press Online