









I think we humans are visual by nature. Think about the expressions we use: "I just can't picture that"; "one picture is worth a thousand words"; or "seeing is believing." Yet we work on a system, the AS/400, that is not by nature visual.
Client/server development can be a bridge between the text-based data on the AS/400 and the visual output that we so easily understand. I've written a client/server utility that creates a diagram of the workstations and printers attached to the local workstation controllers. Even if you don't need a workstation diagram, you should find this article useful. The utility ties together many of the client/server concepts that we've discussed in Midrange Computing, including Object Linking and Embedding (OLE), Open Database Connectivity (ODBC), and Visual Basic (VB).
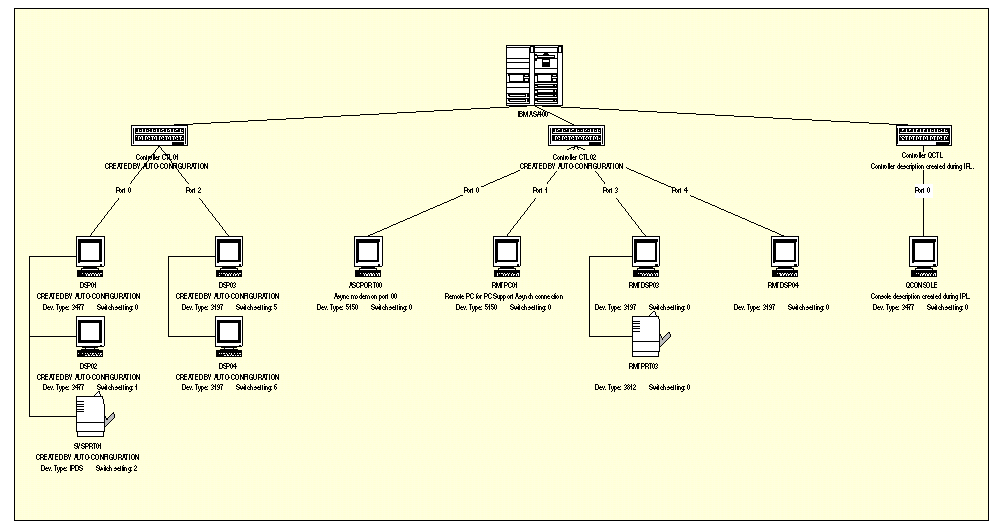
1 shows the output from the utility I wrote. As you can see, it is much easier to understand the structure of your configuration from this graphical output. Let's start by discussing the components of the utility and how to use it.
Figure 1 shows the output from the utility I wrote. As you can see, it is much easier to understand the structure of your configuration from this graphical output. Let's start by discussing the components of the utility and how to use it.
The Big Picture
This program comprises several pieces that fit together to produce the final output. The main pieces are an RPG program, a VB program, and the Visio 3.0 drawing package from Visio Corporation. The Visio drawing package is an excellent PC drawing package that not only can be used to create drawings manually, but also can be programmed through OLE Automation. (For more information on OLE Automation, see the accompanying sidebar.)
To gather the configuration information from the AS/400, an RPG program that uses OS/400 application program interfaces (APIs) is used. The data retrieved by the RPG program is stored in AS/400 database files. ODBC is used to retrieve the data in the configuration files into a VB program, which then uses OLE Automation to create a drawing of the AS/400 work-station configuration using Visio.
Due to space constraints, I'm showing only the code for the VB program?the RPG program and database files are not shown. However, you can download all of the code for this utility from MC-BBS (619-931-9909) or from our Internet Web site (www.as400.com).
How to Run It
Running the utility is a two-step process. First, you must run the RPG program that gathers configuration information. Run the RPG program by changing to the appropriate library and typing
CALL CFG001RG
Once this program has completed, you can run the VB program on your PC to draw the diagram.
You must have Visio installed on your PC before you run the VB program. You must also configure your ODBC data source to point to the appropriate AS/400 library where the database files used by this program reside. Some drivers, like the ODBC driver included with RUMBA Access/400, allow you to specify a library when you connect to the ODBC data source. If your driver supports this, you can specify the library when you run the program. Other drivers require you to specify the library when you create a data source. If this is the case, you must configure the data source to use the appropriate library by using the ODBC administrator program (for more information, see "ODBC Overview," MC, February 1995).
Once your ODBC driver is configured correctly, start the VB program by running the MCCFGDGM program. When the program is started, it prompts you to select an ODBC data source. Choose the appropriate data source for your AS/400 and press OK. The program pauses while it connects to the AS/400. After the program has completed the AS/400 connection, you can start the networking diagramming by pressing the Draw button. This will load Visio and create the drawing from the information gathered by the RPG program. When the drawing is completed, the program will beep and display a message box informing you that the operation has completed.
At this point, the drawing is completely a Visio drawing file. From Visio, you can save, modify, or print the diagram. I found that the best way to print the diagram was to have Visio scale the drawing onto a single page. When you have a large drawing comprising several pages, Visio can shrink the drawing to fit on a single page. You can do this by selecting the Print Setup menu option from Visio's File menu, clicking on the Fit On radio button, and entering one page across and one page down. If you have a large diagram, one page might be a little small, but, for our system, one page worked well. If you have a large AS/400 with many connections, scale it to several pages across by one page down. The diagram is designed to be 11.5" tall and as wide as necessary to fit all workstations on the drawing, so if you need to span several pages, set the printer to print in portrait mode for the best results.
An Overview of the Process
The main tool that does the nice output is the Visio drawing package. Using this tool, you could draw a very nice workstation diagram manually. But why go to all that effort when, with a little programming, you could make it automatic? You see, Visio supports OLE Automation. In a previous article ("Using OLE with AS/400 Data," MC, July 1995), we explained OLE Automation and showed a VB program that used it to create a Word document. For this article, we will again use OLE Automation to extend the functionality of VB.
Gathering Configuration Information with RPG
Before the workstation configuration diagram can be drawn in VB, we need to retrieve the configuration information from the AS/400. But how to get that information? An obvious method would be to take the spooled file output from the Work with Configuration Status (WRKCFGSTS) command and convert it to a file that could be retrieved and analyzed in the VB program, but the format of that output could be different with different versions of OS/400. It could even change with the next release, rendering our program unusable. How can we avoid this situation? Enter the OS/400 APIs. Using these APIs, it is possible to retrieve configuration information directly into an application program. If IBM wants to maintain backward compatibility with existing systems, these APIs will have to remain fairly stable in future releases of OS/400.
The ones used for this article are the APIs to gather configuration information and the APIs to create and retrieve information from user spaces. There are data structures for each of the different formats of every API call defined in the QATTRPG file in the QUSRTOOL library.
The first thing the RPG program does is create a user space by calling the QUSCRTUS API. Then, the QDCLCFGD API is called to retrieve a list of the configuration descriptions into the user space. The information retrieved by the API is equivalent to the information you would see if you issued the following command from a command line, which would list the local workstation controllers:
 WRKCFGSTS CFGTYPE(*CTL) +
   CFGD(*LWS)
Each entry in the list contains the name of a controller description. Each controller description is processed by calling the QDCRCTLD API to retrieve the text for the controller description and a list of the attached devices. A record is written to a database file for each controller description and another loop is used to access the attached devices. For each attached device, the QDCRDEVD API is used to retrieve the device description. Each device description is written to another database file.
Point to Point: The VB Code
Now, let's look at the VB program that uses the information in the database files to create the network chart. When the VB program is run, the first thing it does is establish a connection to your AS/400 (label A in 2 on page 44). This is done by opening a database with the connect parameter of "ODBC;". By not specifying a data source, VB will display a dialog box showing the list of available data sources. If desired, a particular data source can be specified in this parameter so the user will not see the dialog box. Once the ODBC connection is established, the form is displayed.
Now, let's look at the VB program that uses the information in the database files to create the network chart. When the VB program is run, the first thing it does is establish a connection to your AS/400 (label A in Figure 2 on page 44). This is done by opening a database with the connect parameter of "ODBC;". By not specifying a data source, VB will display a dialog box showing the list of available data sources. If desired, a particular data source can be specified in this parameter so the user will not see the dialog box. Once the ODBC connection is established, the form is displayed.
When the user presses the Draw button, the code for the cmdDraw click event is executed. This routine is where the action takes place. First, a new Visio session is established with the CreateObject statement (label B in 2). This statement creates an object of the class specified in the parameter. In this case, it is the visio.application class, which is the top-level Visio object.
When the user presses the Draw button, the code for the cmdDraw click event is executed. This routine is where the action takes place. First, a new Visio session is established with the CreateObject statement (label B in Figure 2). This statement creates an object of the class specified in the parameter. In this case, it is the visio.application class, which is the top-level Visio object.
You should be aware of the differences between the CreateObject statement and the GetObject statement. Because the CreateObject statement actually creates an instance of the class specified, you must wait for a new instance of Visio to be loaded. However, the GetObject statement retrieves an existing class from an already running application, which is less time consuming. When I was creating and debugging this example, I used GetObject for speed. When I was finished debugging, I switched back to CreateObject so a new copy of Visio could be loaded when the application ran.
Once the OLE Automation session with Visio is established, a new drawing is added and the Network shape template is loaded (label C in 2). This template contains the AS/400 shape as well as other shapes that we will use in the drawing. I also turned off screen updating while the application is running because this speeds up the program considerably. If you wish to watch what is going on while the program is running, comment out the following line:
Once the OLE Automation session with Visio is established, a new drawing is added and the Network shape template is loaded (label C in Figure 2). This template contains the AS/400 shape as well as other shapes that we will use in the drawing. I also turned off screen updating while the application is running because this speeds up the program considerably. If you wish to watch what is going on while the program is running, comment out the following line:
appVisio.ScreenUpdating = False
The total number of ports is retrieved to determine the width of the drawing (label D in 2). Since there aren't a fixed number of ports in use on a controller, the total number of controllers can't be used to accurately determine the page width. The width of each port is set to 2.5". The page width is equal to 2.5" multiplied by the number of ports plus 1" for a margin. This seems to produce a readable drawing. The drawing is done on a single large page rather than several pages of standard size. This way, the program doesn't need to figure out which page a particular item belongs on. The page is divided correctly when it is printed by Visio. This method also makes it easier to scale the drawing to the number of pages you want when printing.
The total number of ports is retrieved to determine the width of the drawing (label D in Figure 2). Since there aren't a fixed number of ports in use on a controller, the total number of controllers can't be used to accurately determine the page width. The width of each port is set to 2.5". The page width is equal to 2.5" multiplied by the number of ports plus 1" for a margin. This seems to produce a readable drawing. The drawing is done on a single large page rather than several pages of standard size. This way, the program doesn't need to figure out which page a particular item belongs on. The page is divided correctly when it is printed by Visio. This method also makes it easier to scale the drawing to the number of pages you want when printing.
The total number of devices is retrieved to update the progress flood bar that moves across the screen (label E in 2). Since the lowest common denominator of this drawing is the devices, it provides an easy way to get a relatively accurate completion percentage. The flood bar is a 3D panel (pnlProgress) from the THREED.VBX control. This VBX is in the Professional Edition of VB. If you don't have the Professional Edition, simply remove the references to the pnlProgress control and change the database operations to refer to a data control, and the program should still run. You just won't get a status update as the program runs.
The total number of devices is retrieved to update the progress flood bar that moves across the screen (label E in Figure 2). Since the lowest common denominator of this drawing is the devices, it provides an easy way to get a relatively accurate completion percentage. The flood bar is a 3D panel (pnlProgress) from the THREED.VBX control. This VBX is in the Professional Edition of VB. If you don't have the Professional Edition, simply remove the references to the pnlProgress control and change the database operations to refer to a data control, and the program should still run. You just won't get a status update as the program runs.
The next step is to place the AS/400 in the middle of the page. This is done by using the Drop method to place an object on the Page object (label F in 2). The mastObj variable is set to refer to the AS/400 shape on the Visio shape template. Then, the objShp400 object is created with the Drop method. The center of the page is retrieved by using the following property:
The next step is to place the AS/400 in the middle of the page. This is done by using the Drop method to place an object on the Page object (label F in Figure 2). The mastObj variable is set to refer to the AS/400 shape on the Visio shape template. Then, the objShp400 object is created with the Drop method. The center of the page is retrieved by using the following property:
 objPag.Shapes("ThePage").Cells
   ("PageWidth")
Spelled out, this means "Give me the PageWidth property of the Cells collection of ThePage shape on the page referred to by objPag." A collection is a group of objects of the same type. You can refer to a specific element of a collection by name or by numeric index. Collections are used extensively in VB objects such as dynasets and snapshots. Think of them as fancy arrays. ThePage is a special shape in Visio that is present in all drawings. It refers to, incredibly enough, the page of a drawing.
Once the AS/400 has been placed on the drawing, each controller and its attached devices are drawn (label G in 2). The utility determines the amount of space that each controller takes on the page by determining the number of ports in use on the controller and multiplying by 2.5" and adding 1/2" for the margin. The fXOffset variable keeps track of where the last controller was drawn on the page so the new controller doesn't overlap the ones that have already been drawn.
Once the AS/400 has been placed on the drawing, each controller and its attached devices are drawn (label G in Figure 2). The utility determines the amount of space that each controller takes on the page by determining the number of ports in use on the controller and multiplying by 2.5" and adding 1/2" for the margin. The fXOffset variable keeps track of where the last controller was drawn on the page so the new controller doesn't overlap the ones that have already been drawn.
The AS/400 is connected to the controllers by Visio shapes called connectors. It took me a while to get the idea that connectors are shapes too, but, once I did, it was easy to figure out how to use them. To programmatically connect shapes using these connectors, use the GlueTo method to attach each end point of the connector to points on the objects that you want to connect. Each end point is referred to by
CELLS("BeginX")
or
CELLS("EndX")
When the Drop method (label H in 2) is used to create the connectors, where the connector is dropped doesn't matter because, when the connection is made between two shapes, the connector is moved automatically. If you move shapes that are connected, either manually or programmatically, the connections move with the shapes.
When the Drop method (label H in Figure 2) is used to create the connectors, where the connector is dropped doesn't matter because, when the connection is made between two shapes, the connector is moved automatically. If you move shapes that are connected, either manually or programmatically, the connections move with the shapes.
The type of device to draw is set in the GetDeviceType function (label I in 2). This function takes an argument that is the device category and returns the Visio shape name used to represent that device category. Currently, it supports only displays and printers, but it could be easily expanded to include other types of devices by adding additional statements to the Select Case clause. The devices are connected by a Visio connector called a Universal Connector. This special type of connector will join two shapes without drawing over each one. It gives the connected terminals the "daisychain" look on the drawing. Each device shape is scaled to 1/2" tall by 1/2" wide, so the devices fit on an 11.5" tall page in a 2.5" wide column.
The type of device to draw is set in the GetDeviceType function (label I in Figure 2). This function takes an argument that is the device category and returns the Visio shape name used to represent that device category. Currently, it supports only displays and printers, but it could be easily expanded to include other types of devices by adding additional statements to the Select Case clause. The devices are connected by a Visio connector called a Universal Connector. This special type of connector will join two shapes without drawing over each one. It gives the connected terminals the "daisychain" look on the drawing. Each device shape is scaled to 1/2" tall by 1/2" wide, so the devices fit on an 11.5" tall page in a 2.5" wide column.
Finally, at the end of the loop, the progress indicator pnlProgress is updated to reflect the current percentage of the devices drawn (label J in 2). This is done by updating the FloodPercent property with the number of devices drawn so far divided by the total number of devices. This fraction is then multiplied by 100 to make it a percentage.
Finally, at the end of the loop, the progress indicator pnlProgress is updated to reflect the current percentage of the devices drawn (label J in Figure 2). This is done by updating the FloodPercent property with the number of devices drawn so far divided by the total number of devices. This fraction is then multiplied by 100 to make it a percentage.
The Journey's End
Many things can be done to enhance this utility. How about gathering information about the AS/400, such as the system and network name, and displaying it on the drawing? Or diagramming connections to other AS/400s? Or combining information about your LAN with this drawing? The possibilities are limited only by imagination as the tools now available provide capabilities that would have been much more difficult to implement in the past.
Brian Singleton is an associate technical editor for Midrange Computing.
REFERENCE
Microsoft Visual Basic Programmer's Guide. USA: Microsoft Corporation, 1995 (ISBN 58513-TR6).
Client/Server at Work
What Is OLE Automation?
Object Linking and Embedding (OLE) is a cornerstone of Microsoft's future directions in both the application and operating system arenas. OLE Automation is a piece of that strategy. When a program is capable of OLE Automation, it exposes objects and the properties and methods of those objects that can be utilized by other programs. Any program that is capable of acting as an OLE Automation client can utilize those objects. What it boils down to is that you can use any capable language you want as a macro language to control programs that implement OLE Automation. This is beneficial because you don't need to learn a different macro language for each package you want to customize.
Visio as an OLE Automation Server
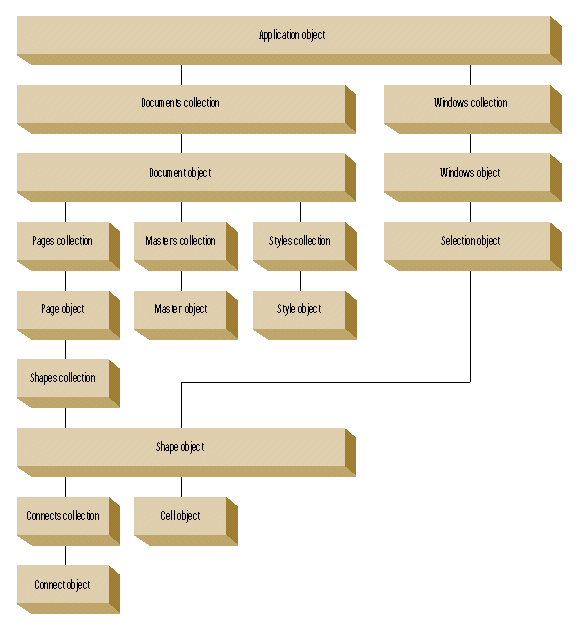
Visio has long been known for its implementation of OLE. In fact, Visio Corporation (formerly Shapeware Inc.) beat Microsoft at its own game by being the first to market with a product capable of OLE Automation. Visio is an excellent example of an OLE Automation server. It is very logically organized, with everything being object-oriented. Here is an example of the hierarchy of the objects in Visio. The application itself is an object. All the documents that are open in the window are objects in the Documents collection. Each page of each document is an object. Each shape on each page is an object. Finally, there are cells, which are objects that tell Visio how to draw each shape. Each cell in each shape is an object. A partial Visio object tree is shown in A1. Talk about drill-down. (For more information on OLE Automation, see "Using OLE with AS/400 Data," MC, July 1995.)
Visio has long been known for its implementation of OLE. In fact, Visio Corporation (formerly Shapeware Inc.) beat Microsoft at its own game by being the first to market with a product capable of OLE Automation. Visio is an excellent example of an OLE Automation server. It is very logically organized, with everything being object-oriented. Here is an example of the hierarchy of the objects in Visio. The application itself is an object. All the documents that are open in the window are objects in the Documents collection. Each page of each document is an object. Each shape on each page is an object. Finally, there are cells, which are objects that tell Visio how to draw each shape. Each cell in each shape is an object. A partial Visio object tree is shown in Figure A1. Talk about drill-down. (For more information on OLE Automation, see "Using OLE with AS/400 Data," MC, July 1995.)
All the elements are put together in a way that makes sense. My only complaint with the product would be the lack of printed documentation for each object, property, and method. There is an entire manual devoted to programming Visio with OLE Automation, but to get details on a particular object, you have to consult the online help file provided. I still prefer written documentation, with an online reference as a backup.
An interesting capability of Visio is the ability to create customized shapes. You can create your own shapes to represent anything you wish. Also, these shapes can be set to call any EXE program when they are double-clicked. This means the shapes can be extended with custom functionality, such as extending the provided AS/400 shape to retrieve the system and network names from your AS/400 when the shape is double-clicked.
VB3 as an OLE Client
There are a couple of different ways to handle OLE objects and OLE Automation with Visual Basic 3.0 (VB3). One of the ways is to use the OLE 2.0 container control (MSOLE2.VBX) provided with VB. This control provides the ability to display the OLE object and also to control it through OLE Automation. However, this control falls short in its implementation of OLE. One feature the OLE specification provides for and the OLE VBX doesn't support is menu negotiation. When properly implemented, menu negotiation provides the ability to display the server program's menu items in the client program when the OLE object is selected. You see this when you embed an Excel spreadsheet in a Word document. When you click on the spreadsheet inside the document, the menus change from Word commands to Excel commands. The MSOLE2.VBX control also falls short in its ability to display the object properly. It is a difficult task to get the object to display exactly the way you wish using this control.
Another method of handling OLE automation objects within VB3 is to dimension them as variables of the type OBJECT. This allows them to be manipulated using their own properties and methods. The disadvantage of this method is that it is not visual for the user in the VB program. However, as demonstrated by this utility, the native program can still be used to handle the visual aspects.
When you dimension variables as type OBJECT, you use the SET statement to make the variable refer to a particular object. You can refer to the properties and methods of that object using the Object.Property or Object.Method conventions. This is similar to how database objects are referred to in VB3. For instance, when you refer to the recordset property of a snapshot, you say
snapshot.recordcount
The recordcount is a property of the snapshot object (for more information on VB database objects, see the Microsoft Visual Basic Programmer's Guide).
Oiling Up OLE
With the introduction of VB4, the creation of OLE Automation objects comes to the hands of mere mortals. VB4 also makes it easier to interact with existing OLE Automation objects by providing some syntactical shortcuts and enhanced functionality. For an in-depth look at VB4, see "Microsoft's Visual Basic 4.0," elsewhere in this issue.
Understanding OLE and what it can do for you will become more and more important. With Microsoft strongly pushing the OLE architecture and most major vendors adopting it, it is reasonable to assume that OLE will be a key technology for the future.
Client/Server at Work
Figure A1: Partial Visio Object Hierarchy
Client/Server at Work
Figure 1: The MCPGMR AS/400 Workstation Configuration
Client/Server at Work
Figure 2: Visual Basic Program
 VERSION 2.00
 Begin Form frmCfgDiag
    BackColor       =   &H00C0C0C0&
    Caption         =   "AS/400 Local Configuration Diagrammer"
    ClientHeight    =   2040
    ClientLeft      =   3192
    ClientTop       =   2220
    ClientWidth     =   3912
    ClipControls    =   0   'False
    Height          =   2364
    Left            =   3144
    LinkTopic       =   "Form1"
    ScaleHeight     =   2040
    ScaleWidth      =   3912
    Top             =   1944
    Width           =   4008
    Begin CommandButton cmdExit
       Caption         =   "E&xit"
       Height          =   372
       Left            =   2244
       TabIndex        =   3
       Top             =   1536
       Width           =   1200
    End
    Begin SSPanel pnlProgress
       Caption         =   "Panel3D1"
       FloodType       =   1  'Left To Right
       Height          =   288
       Left            =   108
       TabIndex        =   1
       Top             =   300
       Visible         =   0   'False
       Width           =   3696
    End
    Begin CommandButton cmdDraw
       Caption         =   "&Draw"
       Height          =   372
       Left            =   456
       TabIndex        =   0
       Top             =   1536
       Width           =   1200
    End
    Begin Label lblStatus
       BackColor       =   &H00C0C0C0&
       FontBold        =   0   'False
       FontItalic      =   0   'False
       FontName        =   "MS Sans Serif"
       FontSize        =   7.8
       FontStrikethru  =   0   'False
       FontUnderline   =   0   'False
       Height          =   312
       Left            =   108
       TabIndex        =   2
       Top             =   960
       Width           =   3696
    End
 End
 Option Explicit

 Dim db As database
 Dim ss As snapshot
 Const HOURGLASS=11
 Const DEFAULT=0
 Const DB_SQLPASSTHROUGH=64

 Sub cmdDraw_Click ()
   Dim appVisio As object
   Dim objDocs As object
   Dim objDoc As object
   Dim objPags As object
   Dim objPag As object
   Dim objShp As object
   Dim mastObj As object
   Dim objStn As object
   Dim objShp400 As object
   Dim objConnect As object
   Dim objCtl As object
   Dim nController As Integer
   Dim nDevice As Integer
   Dim nNumCtl As Integer
   Dim fXOffset As Single
   Dim nNumPortsPerCtl As Integer
   Dim nTotalPorts As Integer
   Dim nPort As Integer
   Dim nNumDevPerPort As Integer
   Dim ssCtl As snapshot
   Dim ssDev As snapshot
   Dim ssScratch As snapshot
   Dim ssPort As snapshot
   Dim nTotalDevs As Integer
   Dim nTotalDevsDone As Integer
   Dim nTotalPortsDone As Integer

   On Error GoTo cmdDrawError

   screen.MousePointer = HOURGLASS
   Me.Enabled = False
   pnlProgress.Visible = True
   Set appVisio = CreateObject("visio.application")
   Me.ZOrder 0
   Set objDocs = appVisio.Documents
   Set objDoc = objDocs.Add("network.vst")
   Set objStn = appVisio.Documents("network.vss")
   Set objPags = objDoc.Pages
   Set objPag = objPags(1)
   ' Turn off screen updating for speed
   appVisio.ScreenUpdating = False
   ' Get the data about the controller
   Set ssCtl = db.CreateSnapshot("Select * from CFGCTL", DB_SQLPASSTHROUGH)
   ' Get the total number of controllers
   ssCtl.MoveLast
   ssCtl.MoveFirst
   nNumCtl = ssCtl.RecordCount

   ' Retrieve the total number of ports
   Set ssScratch = db.CreateSnapshot("Select ctlnm,DEVPT from CFGDEV
     group by CTLNM,DEVPT", DB_SQLPASSTHROUGH)
   ssScratch.MoveLast
   nTotalPorts = ssScratch.RecordCount

   ' Retrieve the total number of devices
   Set ssScratch = db.CreateSnapshot("Select DEVNM from CFGDEV",
     DB_SQLPASSTHROUGH)
   ssScratch.MoveLast
   nTotalDevs = ssScratch.RecordCount

   'Set the page size
   objPag.Shapes("ThePage").Cells("PageWidth").Formula =
     (nTotalPorts * 2.5) + 1
   objPag.Shapes("ThePage").Cells("PageHeight").Formula = 11

   ' Drop the AS/400 in the middle of the drawing
   Set mastObj = objStn.Masters("IBM AS/400")
   Set objShp400 = objPag.Drop(mastObj, (objPag.Shapes("ThePage").Cells("PageWidth") / 2) + .25, 10.25)

   ' Draw each controller
   For nController = 1 To nNumCtl
     lblStatus = "Retrieving Ports For Controller"
     DoEvents
     Set ssPort = db.CreateSnapshot("Select distinct ctlnm,devpt from
       cfgdev where ctlnm='" & ssCtl("ctlnm") & "'", DB_SQLPASSTHROUGH)
     ssPort.MoveLast
     ssPort.MoveFirst
     lblStatus = "Drawing Controller"
     DoEvents
     ' Get the total width of this controller
     ' which is 2.5" for each port
     nNumPortsPerCtl = ssPort.RecordCount
     fXOffset = (nTotalPortsDone * 2.5) + 1.5
     nTotalPortsDone = nTotalPortsDone + nNumPortsPerCtl
     ' Drop the controller in the middle of the drawing area
     Set mastObj = objStn.Masters("Mux / Demux")
     Set objCtl = objPag.Drop(mastObj, fXOffset + (((nNumPortsPerCtl - 1)
       * 2.5) * .5), 9.5)
     ' Set the name and text of this controller
     objCtl.Text = "Controller " & ssCtl("ctlnm") & Chr$(13) & Chr$(10) &
       ssCtl("ctlds")

     ' Glue it to the AS/400 with a line connector
     Set mastObj = objStn.Masters("Line Connector")
     Set objConnect = objPag.Drop(mastObj, 4.25, 5.5)
     objConnect.Cells("BeginX").GlueTo objShp400.Cells("AlignBottom")
     objConnect.Cells("EndX").GlueTo objCtl.Cells("AlignTop")

     For nPort = 1 To nNumPortsPerCtl
       Set ssDev = db.CreateSnapshot("Select * from cfgdev where ctlnm='"
         & ssCtl("ctlnm") & "' and devpt=" & ssPort("devpt"),
         DB_SQLPASSTHROUGH)
       ssDev.MoveLast
       ssDev.MoveFirst
       nNumDevPerPort = ssDev.RecordCount
       ' Now draw the devices
       For nDevice = 1 To nNumDevPerPort
         lblStatus = "Drawing Controller: " & Trim$(ssCtl("ctlnm"))
           & " Port: " & nPort & " Device: " & nDevice
         DoEvents
         'Drop the device on the controller
         Set mastObj = objStn.Masters(GetDeviceType((ssDev("devct"))))
         'Down 1 inch for each terminal
         Set objShp = objPag.Drop(mastObj, fXOffset + ((nPort - 1) * 2.5),
           9 - nDevice)
         ' Size the terminal correctly
         objShp.Cells("Height").Formula = .5
         objShp.Cells("Width").Formula = .5
         objShp.Text = ssDev("DevNm") & Chr$(13) & Chr$(10)
           & ssDev("devds") & Chr$(13) & Chr$(10) & "Dev. Type: "
           & ssDev("DEVTP") & "  Switch setting: " & ssDev("Devsw")
         If nDevice = 1 Then
           ' If this is the first device, connect it to the controller
           Set mastObj = objStn.Masters("Line Connector")
           Set objConnect = objPag.Drop(mastObj, 4.25, 5.5)
           objConnect.Cells("BeginX").GlueTo objCtl.Cells("AlignBottom")
           objConnect.Cells("EndX").GlueTo objShp.Cells("AlignTop")
           objConnect.Text = "Port " & ssDev("devpt")
         Else
           ' Otherwise, glue it to the previous device
           objConnect.Cells("EndX").GlueTo objShp.Cells("AlignLeft")
         End If
         ' Attach another connector if needed for the next device
         If nDevice <> nNumDevPerPort Then
           Set mastObj = objStn.Masters("Universal Connector")
           Set objConnect = objPag.Drop(mastObj, 4.25, 5.5)
           objConnect.Cells("BeginX").GlueTo objShp.Cells("AlignLeft")
         End If
         nTotalDevsDone = nTotalDevsDone + 1
         pnlProgress.FloodPercent = (nTotalDevsDone / nTotalDevs) * 100
         DoEvents
         ssDev.MoveNext
       Next nDevice
       ssPort.MoveNext
     Next nPort
     ssCtl.MoveNext
   Next nController
   appVisio.ScreenUpdating = True
   pnlProgress.Visible = False
   lblStatus = ""
   DoEvents
   screen.MousePointer = DEFAULT
   Me.Enabled = True
   Beep
   MsgBox "The Visio AS/400 workstation drawing is finished. Use Visio
     to print it after scaling it to your liking.", , "Drawing Finished"
   Exit Sub

 cmdDrawError:
   screen.MousePointer = DEFAULT
   Me.Enabled = True
   MsgBox Err & " " & Error$
   Exit Sub

 End Sub

 Sub cmdExit_Click ()
   End
 End Sub

 Sub Form_Load ()
   On Error GoTo FormLoadError

   screen.MousePointer = HOURGLASS
   lblStatus = "Connecting To Database"
   Me.Move (screen.Width - Me.Width)  2, (screen.Height - Me.Height)  2
   Me.Show
   DoEvents
   Set db = OpenDatabase("", False, False, "ODBC;")
   lblStatus = ""
   screen.MousePointer = DEFAULT
   Exit Sub

 FormLoadError:
   screen.MousePointer = DEFAULT
   MsgBox Err & " " & Error$
   Exit Sub
 End Sub

 Function GetDeviceType (sDevType As String) As String
 '--------------------------------------------------
 ' Return the proper Visio object name from the
 ' AS/400 device type
 '--------------------------------------------------
   Select Case Trim$(sDevType)
     Case "*PRT"
       GetDeviceType = "Printer"
     Case "*DSP"
       GetDeviceType = "Workstation"
     '--- Add more here ---
   End Select

 End Function

MC Press books written by Brian Singleton available now on the MC Press Bookstore.
 |
||
 |
|
i5/OS and Microsoft Office Integration Handbook Harness the power of Microsoft Office while exploiting the iSeries database. List Price $79.95 Now On Sale
|

 Business users want new applications now. Market and regulatory pressures require faster application updates and delivery into production. Your IBM i developers may be approaching retirement, and you see no sure way to fill their positions with experienced developers. In addition, you may be caught between maintaining your existing applications and the uncertainty of moving to something new.
 IT managers hoping to find new IBM i talent are discovering that the pool of experienced RPG programmers and operators or administrators with intimate knowledge of the operating system and the applications that run on it is small. This begs the question: How will you manage the platform that supports such a big part of your business? This guide offers strategies and software suggestions to help you plan IT staffing and resources and smooth the transition after your AS/400 talent retires. Read on to learn:
LATEST COMMENTS
MC Press Online