








Is your BI solution hard to install and difficult to use?
Is your data out-of-date and your report backlog still a backlog? Is your BI technical department larger than two people, and do they spend most of their time redefining your data to make the solution work? Does your technical team spend hours upon hours installing program fixes? Does your solution work with only one database, and is it too complicated to allow end users to write their own inquiries? Do you have to pay more any time you want to do more? Is your BI solution meeting your needs?
SEQUEL Is Easy
SEQUEL provides access to DB2 and other databases without your having to redefine the world. It's easy to locate your files (tables) and define reports from the queries you've created. Because it's been on the market for over 20 years, SEQUEL is a stable and reliable tool for accessing your data. You select the end user interface that's best for you: green-screen, graphical Windows desktop, or Web browser. Your data is always current because SEQUEL is connected to the live database. You no longer have to deal with stale data (see Figure 1).

Figure 1: The SEQUEL user interface is easy to use. (Click images to enlarge.)
Create Professional-Looking Reports
A SEQUEL administrator, or even an end user, can easily convert queries into professional-looking reports by using the SEQUEL report wizard. You can create most reports in four simple steps. Do you need to add a field or move a column for some government regulation? Or do you need to email a report to a customer or end user? The SEQUEL report generator can build a text-based report in minutes.
Add Graphical Formatting to Your Report
It's easy to add a logo or graph to a report with SEQUEL's Client Reporting Option (see Figure 2).

Figure 2: The end user sees a report with critical information plus graphics.
Use Customized Dashboards to Display Your Key Business Data
SEQUEL Executive Dashboards let you combine multiple SEQUEL objects (views or graphs), images, Windows applications, and Web browser windows into a single dashboard display. Everyone--from executives to non-technical management to end users--can create their own Executive Dashboards. Dashboards allow you to view a wide variety of important metrics with the click of a desktop icon.
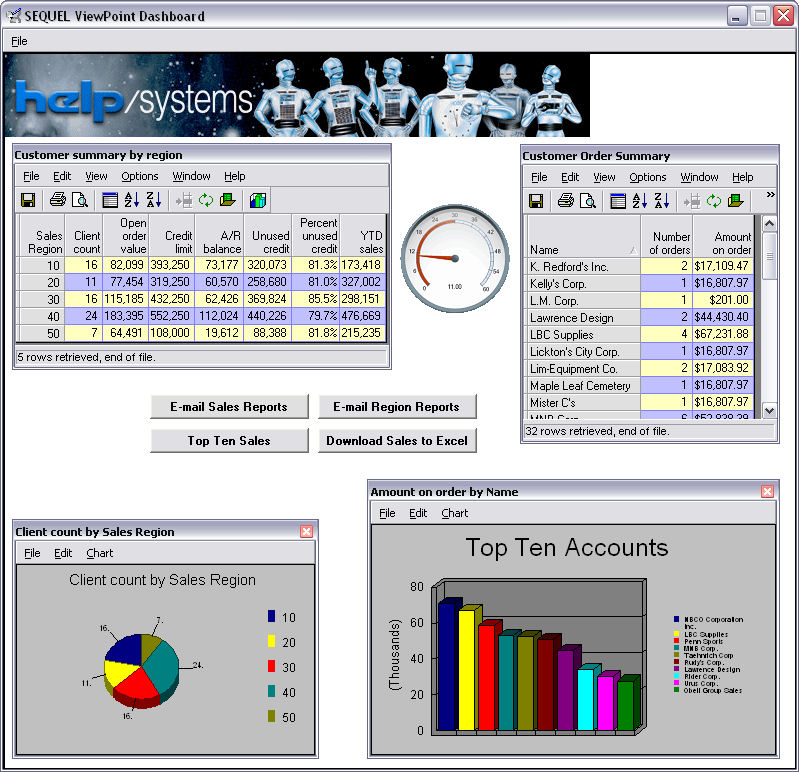
Figure 3: Design an Executive Dashboard to display the information you need.
Answer your business problems today with SEQUEL. It's easy to use, reliable, and hassle-free. With no extra costs, and the same support team you love to work with, you can solve most of your data access needs. Call us at 1.800.328.1000 and ask for a live demo or click here to learn more or to get a free 30?day trial. And check out Help/Systems' other offerings in the MC Showcase Buyer's Guide.

 Business users want new applications now. Market and regulatory pressures require faster application updates and delivery into production. Your IBM i developers may be approaching retirement, and you see no sure way to fill their positions with experienced developers. In addition, you may be caught between maintaining your existing applications and the uncertainty of moving to something new.
 IT managers hoping to find new IBM i talent are discovering that the pool of experienced RPG programmers and operators or administrators with intimate knowledge of the operating system and the applications that run on it is small. This begs the question: How will you manage the platform that supports such a big part of your business? This guide offers strategies and software suggestions to help you plan IT staffing and resources and smooth the transition after your AS/400 talent retires. Read on to learn:
LATEST COMMENTS
MC Press Online