


Eclipse is a mature, stable, and feature-rich integrated development environment (IDE) in which a wide variety of programming languages are supported, namely Java. Although we all like to think that we write perfect code, we don't. As such, we often find ourselves mercilessly sifting through our code, trying to debug a problem, all whilst polluting it with System.out.println("Got here!"); and System.out.println("Got there!"); lines. It turns out there's a far better way to debug.
Eclipse has an excellent debugger that's available out of the box. A debugger is a tool that can be used to set breakpoints (i.e., a point of execution at which the program will pause) and allow you to precisely see what's going in within your program.
(Note: The steps presented in this article are also compatible with IBM's Rational Application Developer product.)
Great! So Where Do I Start?
As an initial point of reference, it's assumed that you've already created an Eclipse-based Java project and you're now to the point where you want to debug a problem. The following block of code illustrates a simple program with an embedded problem for the sake of this tutorial:
package example.debugger;
public class MyMain {
private static class Person {
private String name;
private int age;
public Person(String name, int age) {
this.name = name;
this.age = age;
}
public int getAge() { return age; }
public String getName() { return name; }
}
public static void main(String[] args) {
Person p1;
Person p2;
p1 = new Person("John", 35);
p2 = new Person(null, 28);
System.out.println("The length of Person 1's name is:
" + p1.getName().length());
System.out.println("The length of Person 2's name is:
" + p2.getName().length());
}
}
Executing this program results in a NullPointerException being thrown from MyMain.java:25. Obviously, the problem is a result of calling the length() method on the null object p2.getName(), but let's walk through using the debugger anyway.
Step 1: Set Your Breakpoint(s)
In this case, you'll want to open the source code for MyMain.java in your source window. Then you can position the cursor on the problematic line.
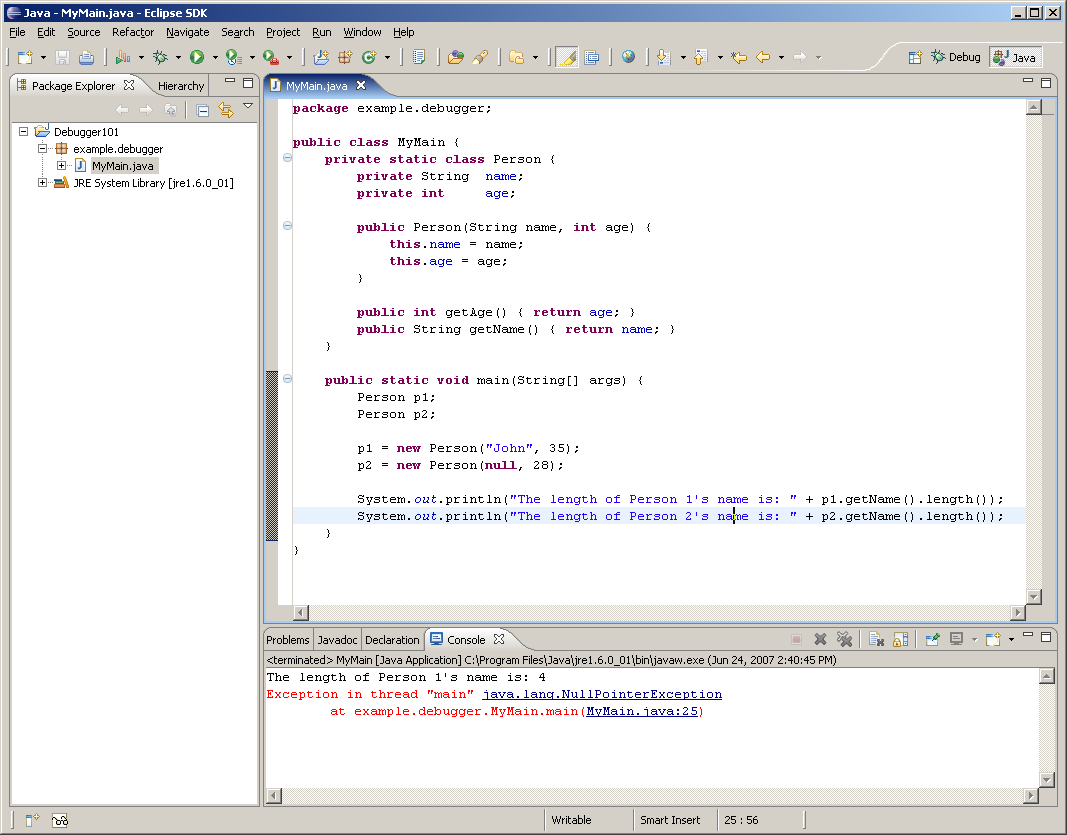
Figure 1: Open the source code for MyMain.java in the source window. (Click images to enlarge.)
Now press CTRL+SHIFT+B to set a breakpoint on the line; a red dot should appear to the left of the line of code to indicate that a breakpoint has been activated on that line.
Step 2: Open the Debug Perspective
To open the debug perspective, click on Window>Open Perspective>Debug, as shown below.
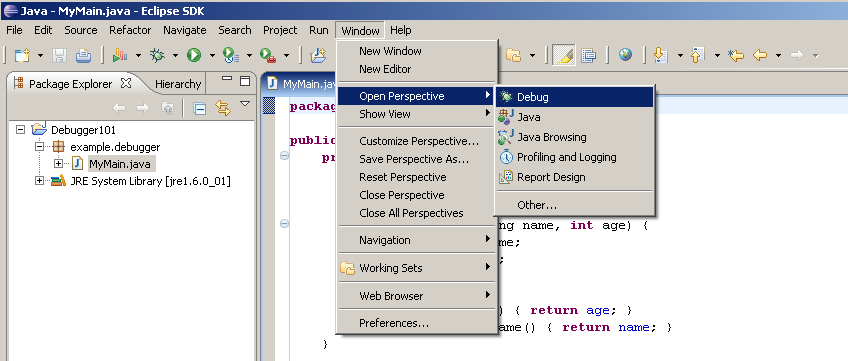
Figure 2: Click on Window>Open Perspective>Debug.
As shown below, your screen will be segmented into various regions.

Figure 3: The screen is segmented into regions.
Circled in red is a list of all breakpoints that you've defined for your program. Here, you have only one breakpoint defined, but in many cases it's desirable to have several set. You can also right-click any of the breakpoints and work with their properties. For example, you can configure a breakpoint to take effect only after it's been "touched" n times, or some other user-defined predicate is satisfied, etc.
Step 3: Run the Application in Debug Mode
Now that your breakpoint has been set and you're in the debug perspective, it's time to run your program so you can see what's going on. Click on Run>Debug Last Launched (or simply press F11) to debug the application.
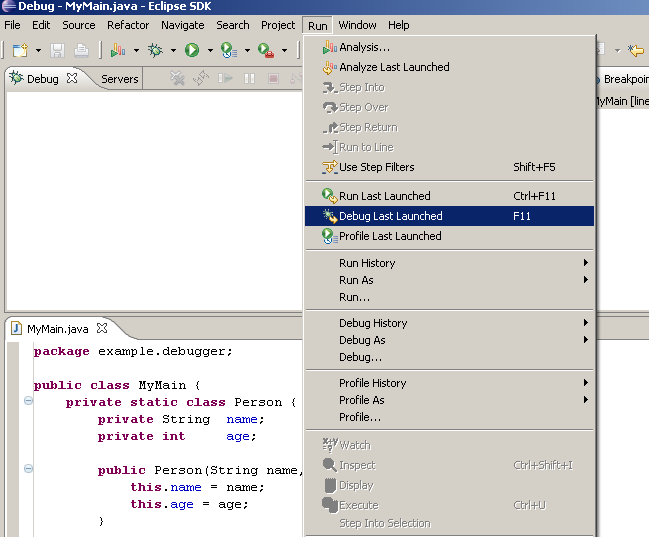
Figure 4: Click on Run>Debug Last Launched to debug the application.
Now the program will start running until a breakpoint is encountered and all of its conditions are met (e.g., if you set its "hit count" to 5, the breakpoint will need to be encountered five times), at which point the program will pause, as shown below.

Figure 5: The program has paused.
You can see in the console window that the first line to standard out was successfully written, but now the program is halted on the execution of line highlighted in green (i.e., the line that originally threw the NullPointerException).
Let's now take a look at the internals of the program to diagnose the problem. As shown below, by clicking on the Variables tab in the top right corner, you can see a variety of information about the state of the application.
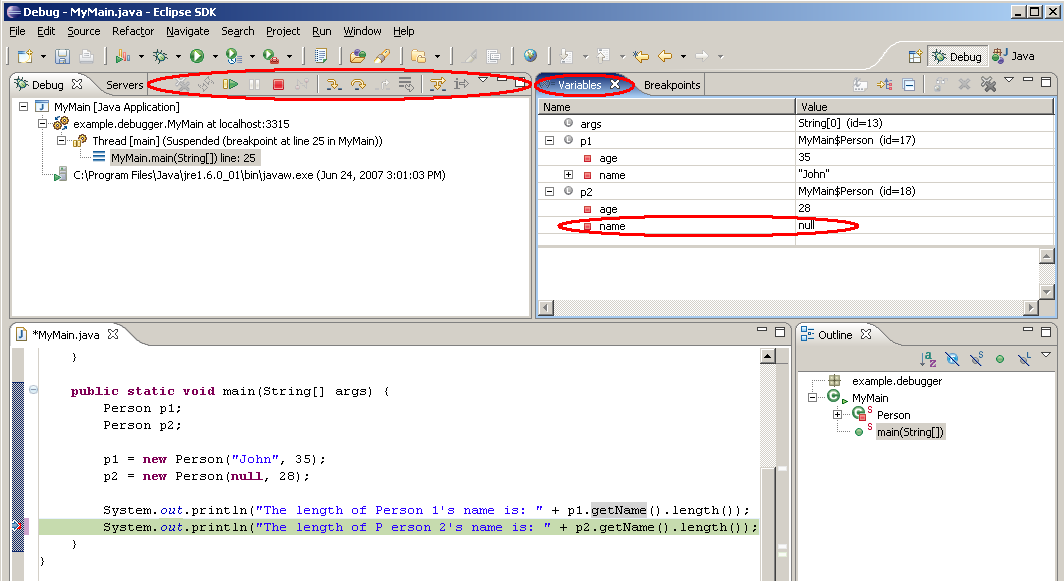
Figure 6: Click the Variables tab to see information about the state of the application.
You can see that the name member of p2 is null, which explains the NullPointerException. Now that you know what was causing the exception, you can proceed to set another set of breakpoints to help determine how the name member of p2 got set to null. To continue running the program, use the buttons on the debug toolbar (circled above) to resume execution, step into the breakpoint, or step over the breakpoint.
Wrapping Up
Although the example showed a trivial problem to fix, you can see the power of having the Eclipse debugger at your disposal. It allows you to set breakpoints anywhere in your program and walk through the runtime logic line by line. You can also use it to debug a multi-threaded program and watch what's happening on a thread-by-thread basis.
Although it's beyond the scope of this article, it's worth noting that you can indeed debug remote programs. The example shown here demonstrates debugging a local program, but Eclipse also has support to debug remotely, and there are a lot of good Web-based articles that explain the process.
Wave "Goodbye" to print lines and say "Hello" to the debugger!
Joe Cropper is a Software Engineer at IBM in Rochester, Minnesota. Joe works as part of the System i Software Final System Test team, and his areas of expertise include database, multi-tiered client-server technologies, and a variety of object-oriented programming languages. Joe can be reached via email at
 Business users want new applications now. Market and regulatory pressures require faster application updates and delivery into production. Your IBM i developers may be approaching retirement, and you see no sure way to fill their positions with experienced developers. In addition, you may be caught between maintaining your existing applications and the uncertainty of moving to something new.
 IT managers hoping to find new IBM i talent are discovering that the pool of experienced RPG programmers and operators or administrators with intimate knowledge of the operating system and the applications that run on it is small. This begs the question: How will you manage the platform that supports such a big part of your business? This guide offers strategies and software suggestions to help you plan IT staffing and resources and smooth the transition after your AS/400 talent retires. Read on to learn:
LATEST COMMENTS
MC Press Online