


Detect reoccurring issues that require investigation.
QMessage Monitor's features include the ability to keep a watchful eye on events occurring in the Audit Journal. It translates audit journal messages into system messages (with a msg ID of UPW*) and escalates exception messages for the attention of administrators in real-time.
One type of exception message is a password failure, which could be either a simple mistype by a user or a valid security breach attempt. Either way, knowing about password failures is an important part of a proactive approach to security monitoring in a System i network.
Dealing with password errors as they occur is important, and using the frequency filter in QMM's autoreplies to send notification if the number of password failures gets too high is also important. But sometimes trends and patterns can be identified more readily by visualizing them. By allowing the eye to see these instances, administrators can detect reoccurring issues that require further investigation.
An easy way to do this is by using QMM's Audit Journal messages as a data source and creating a graph using Excel. You'll need:
- QMM's Activity Log (message log) as the data source. It's physically stored in file MMALOGP.
- Microsoft Excel, as it's fairly widespread and has convenient charts.
- An installed ODBC driver, typically the one that comes with a Client Access (iSeries Access, IBM i Access, etc.) installation.
ODBC
On the PC, set up ODBC connection at Control Panel -> Administrative Tools. On the User DSN tab, add a new data source. For Driver, choose "iSeries Access ODB driver" or "Client Access ODBC driver."
On the General tab:
- Data Source name: "Data source SYSTEMA lib MM", where SYSTEMA = QMM host system and MM = name of QMM product lib
- Description: "Data source for QMM product library on QMM host system"
- System: Select the QMM host system
On the Server tab:
- Default SQL Schema or Library: MM
- Library List: MM
- Connection type: select "Limit to Read-Only (Select statements only)"
- Override default database: enable and set database to MMALOGP
For Performance, choose Advanced and enable "Retrieve extended column information."
Leave other settings at default. Click OK to commit.
Spreadsheet
These instructions are for Excel 2007 or higher, but other spreadsheets are similar.
Start Excel. Create a Query based on ODBC Connection.
On the Data tab, in the Get External Data group, click From Other Sources, and then click From Microsoft Query on the ribbon. Select Other sources.
On the Databases tab, select the "Data source SYSTEMA lib MM" created previously.
Ensure the "Use Query Wizard" option is disabled.
Press OK.
The Query Wizard is displayed:
- In the Add Tables dialog, select MMALOGP, add that table, and close the dialog.
- In the View menu, select SQL.
- Insert the following SQL statement:
Select Cast(LG#MVA As Char(19)) As MsgDateTime, Cast(LGMGID As Char(7)) As MsgID, Cast (LGOMTX As Char(80)) As MsgText, Cast(LG#MVJ As Char(10)) As System, Cast( LG#MVM As Char(30)) As IPAddress, Cast (LG#MVO As Char(10)) AsFrom MMALOGP Where LGMGID Like 'UPW%' Order By MsgDateTime For Fetch Only - Click OK twice to commit.
- The data now corresponds to the query displayed in the Query Wizard.
- Push the floppy icon (remember those?) on the toolbar and save the query under a speaking name, e.g., "Query for password-related events."
- On the icon toolbar, click Exit (next to the floppy) to return to Excel.
Back in Excel, you're asked how you want to add the data to the existing spreadsheet. Take the default and OK.
Name columns G, H, I, and J as follows, respectively: Time, Date, DateTime, and Password Failures
Add the following formulas to the second row of G, H, and I. Excel automatically fills in the whole column for you.
- Column G (Time): =TIME(MID($F2;12;2);MID($F2;15;2);MID($F2;18;2))
- Column H (Date): =DATE(MID($F2;1;4);MID($F2;6;2);MID($F2;9;2))
- Column I (DateTime): =$G2+$H2
- Column J (Password Failures): =ROW(J2)-1
Note: Excel function names in German are Time = Zeit, Date = Datum, Mid = Teil, Row = Zeile.
Select the DateTime and Sequence columns.
Switch to the Insert tab, and add a new chart of type Scatterplot:
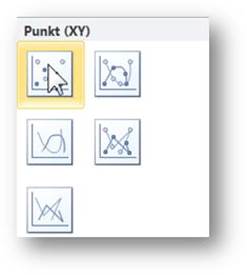
Figure 1: Choose a scatterplot chart.
Congratulations! You just created a visualization of password failures as they occurred on your IBM i:
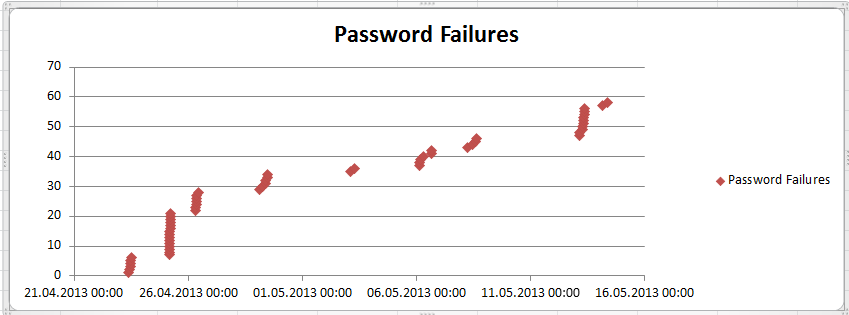
Figure 2: You have a chart of password failures.
The steep vertical line between April 21 and 26 indicates a high frequency of password failure events. We were testing Security Audit Journal functionality at that time. If you're investigating password failures, focus your investigation on those steep lines.
Find out more about QMM's Audit Journal and security monitoring.

 Business users want new applications now. Market and regulatory pressures require faster application updates and delivery into production. Your IBM i developers may be approaching retirement, and you see no sure way to fill their positions with experienced developers. In addition, you may be caught between maintaining your existing applications and the uncertainty of moving to something new.
 IT managers hoping to find new IBM i talent are discovering that the pool of experienced RPG programmers and operators or administrators with intimate knowledge of the operating system and the applications that run on it is small. This begs the question: How will you manage the platform that supports such a big part of your business? This guide offers strategies and software suggestions to help you plan IT staffing and resources and smooth the transition after your AS/400 talent retires. Read on to learn:
LATEST COMMENTS
MC Press Online