Last month, we got into Zend Studio and created a script and ran it in Studio. We’re going to review that a bit this month and start talking about debuggers. Come on, it will be fun.
OK, a month has gone by. You have probably forgotten everything we touched on previously, so let’s get started slowly. We will start by introducing a bug into our PHP script.
A Quick Review
Open Zend Studio by double-clicking on the icon or its entry in the All Programs thingy.
A window asking you to select a workspace may open if you have not set a default value, but you should be able to just click OK. If you want to avoid seeing this in the future, select a default workspace (you probably have only one to choose from). It doesn’t hurt to set a default if you work in one specific workspace most of the time. When you get sophisticated enough to have multiple workspaces, it’s easy to switch by using File > Switch Workspace.
Continuing on, Zend Studio and its many windows will then appear. If when you ended your last session you left the PHP Explorer window open with file1.php on it, then that should still be open.
If not, click on PHP over on the top right side of the screen and the PHP Explorer sub-window will appear. In the PHP Explorer sub-window, find the File1.php script in the TechTip project (or whatever project you put it in) and double-click on it to open it up. Or you could select the TechTip project that we created last month and then click on File > PHP File (it’s quite a way down the list) to open the window to create a new file in this project.
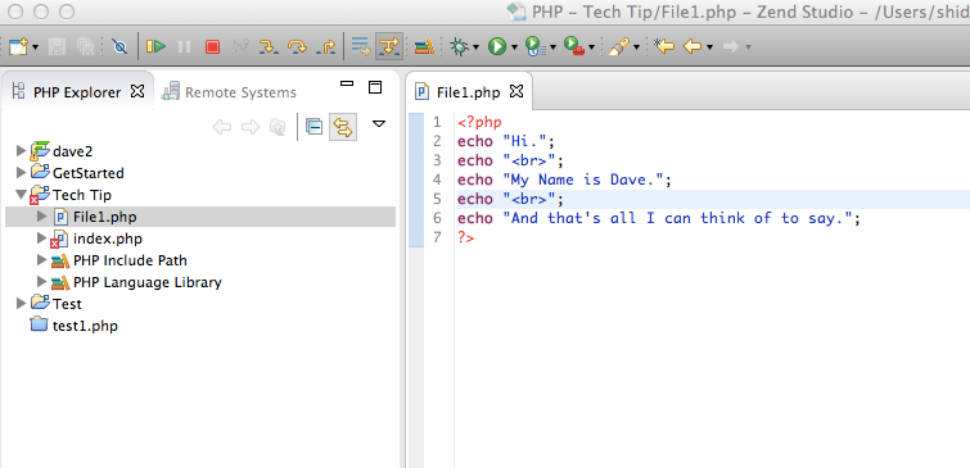
Either way, set up the code in your script so that you have five echo statements as shown below.

Figure 1: This is the PHP script window (good code).
Echo, of course, is the operator that will display something on the browser window. Lines 2, 4, and 6 are pretty self-explanatory; we will show the text there on the bowser page. Lines 3 and 5 are a way of introducing a break line, so rather than the three verbiages being squashed together on one line, each will appear on its own line.
The code looks good, but let’s just make sure by running this script.
Go up to the very top line of the screen, the menu line where it says Zend Studio and File, Edit, Refactor, etc., and slide on over to Run. Position on this to open the drop-down menu and then slip down that to Run again. Click on this Run.
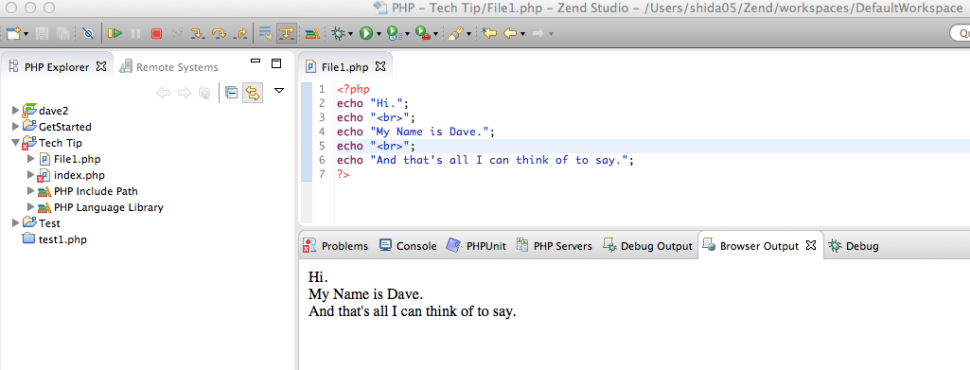
After a moment, you should be able to look at the window in the bottom right. And if you click on the Browser Output tab, it should show you the result of running the script. This is what things look like when everything works correctly.

Figure 2: In the PHP source window, you have good run results.
Introducing a Syntax Error
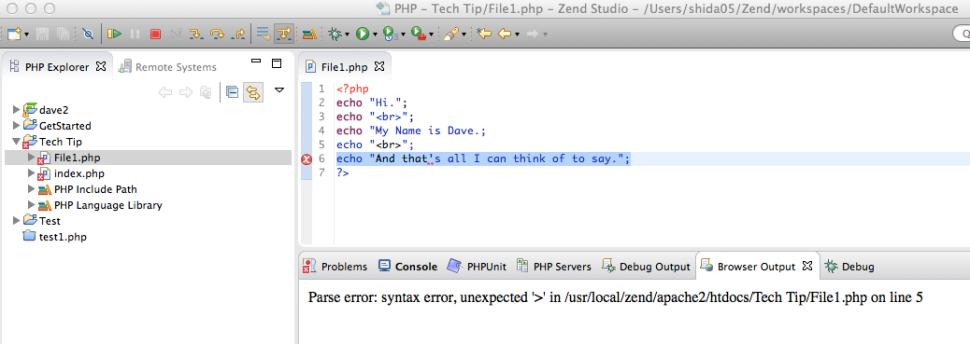
OK, so far, so good. Now here is what we’re going to do. Go to the script source window, and in the code for the second “echo” (the “My Name is Dave” line), remove the second double quote by the period. Thus, the quotes will be out of balance, and we will have a syntax error. Your code should now look like this.

Figure 3: A code error is introduced in the PHP source window.
The first thing you will notice is that there is a little red x on line 6. Things in red are rarely good news, and that is the case here. Unfortunately, it is not as much help as it could be because 6 is not the line that has the problem; that line is actually 4. And the only reason that the x shows up is because Zend Studio is smart enough to recognize a syntax error (a missing quote). Other types of errors would not be called out in this way. (It could be smarter and show the x on the line that was actually having the problem. Details.)
But it’s all good because now you know that there is a problem with syntax and you can visually inspect the lines above this and look for the issue. What happens if we run this script?
Let’s find out. Go up to the file menu and click Save. Don’t close the file; you need it open in the source window so the system knows what script we want to run, but Save what is there. And actually, you don’t even need to do this step because when you run an unsaved script, Studio will prompt you to save it. Yes, it’s all about you.
Once it is saved but still visible, run the script by going to Run, and then Run again just as we did before.
When you do this, the output in the Browser Output window changes, and now it is not so nice. As you can see, it identifies a line but again, that is not really the line that is having the problem. PHP is funny that way.

Figure 4: The PHP source window shows error output.
Debugging in Studio
Of course, this problem is not a difficult one to fix. Nor is it really the type of error that requires some serious debugging. A quick visual inspection of your code is enough to reveal this problem, but for more serious problems, you need to be able to debug.
And that is one of the nice things about Studio: It has a debugger built right in. Can’t get that with WAMP/MAMP/LAMP and a text editor (although most browsers have some debugging capabilities built into them).
In fact, you have two options available to you in Studio. The first is the standard Zend Debugger, and that is what we will use in this tip. The other is to bring in Xdebug, a separate function that can also be used standalone with a text editor and which is very popular in the PHP world. But you can also use it within Studio.
Debugging in Studio is a big topic and covers a lot of areas. It’s not that it’s hard (we will see that it isn’t), but it is broad. There is an awful lot you can do in terms of debugging when using Studio, and we are going to touch on only a small part of what is available. Perhaps we’ll do some more complex debugging later, that is, if I live that long. Not that there’s anything wrong with me…well, of course, there’s something wrong with me, but it’s not physical. Oh, never mind. My doctor says the less I talk about it, the better off I am.
Debug Anyone?
So we could use the Zend Debugger to find and fix this syntax problem, right?
Uh, no, actually we can’t. The Zend Debugger will not work unless the script is syntactically correct.
That’s not so unusual. Even on the IBM i, you can’t debug a program until you get a clean compile. Of course, with PHP you don’t have a compile and you don’t get an object (more or less), but you still need a clean program.
Once you do have this clean script, you can use Zend Debug to set breakpoints, roll down through the script, and determine logic or value errors just like you can in the i.
But that’s not going to happen this month because we are all out of time. But stay tuned as we get into debug and how to use it.


 Business users want new applications now. Market and regulatory pressures require faster application updates and delivery into production. Your IBM i developers may be approaching retirement, and you see no sure way to fill their positions with experienced developers. In addition, you may be caught between maintaining your existing applications and the uncertainty of moving to something new.
 IT managers hoping to find new IBM i talent are discovering that the pool of experienced RPG programmers and operators or administrators with intimate knowledge of the operating system and the applications that run on it is small. This begs the question: How will you manage the platform that supports such a big part of your business? This guide offers strategies and software suggestions to help you plan IT staffing and resources and smooth the transition after your AS/400 talent retires. Read on to learn:
LATEST COMMENTS
MC Press Online