So far, we’ve looked at how to debug only local scripts. But what happens when your program moves to production? Is there even the slightest possibility that you will have to debug it someday?
If you someday have to debug a script that’s in production, you’ll discover pretty quickly that the debug techniques we’ve looked at so far do not work. They’re for local scripts only, and once you put them beyond the bounds of your PC, you need to use something else, something called “remote debugging,” if you want to play with them.
So this month, we want to look at how to set that up because it doesn’t just happen. Come on.
Setting Your PC as a Debug Host
The first thing we need to do is make an adjustment on your IBM i.
Obviously, not everyone who codes for the web has one, and those people who don’t (like someone who is dealing with remote scripts that are held on a Windows or Linux server) use different techniques to enable remote debugging, generally involving special configurations of the firewall for those servers to allow them to get in and debug from their PCs.
We’re lucky enough to have an i, of course, so we’ll look at the situation where our remote scripts are on the i (in /www/zendsvr/htdocs/ on the IFS) and we want to debug them from our local PC.
The first thing we need to do is to get into the UI for Zend Server on your i. Within that tool, select Configurations and then IDE Integration. About halfway down, there’s a spot for IDE Client Filtering for Debugging. Enter the IP address of your PC in here.
Create a PHP Server Definition
Next, start up Zend Studio on your PC.
Now, what you do next could be confusing, and it’s one of the things that I don’t like about Zend Studio: the fact that they seem to reorganize their menus with every new release. I suppose they have to, but it makes it hard to write an article like this for people who might be on different versions of the software. Bottom line is, we want to get to Zend Studio’s Preferences window. If you’re on Version 11 (which is the version the first reference below is based on), then I believe it’s listed under Window on the menu line. If you’re on Version 13 (as I am), then it’s under Zend Studio. If you’re on another version, you might have to look around for it.
Once you find Preferences, things should pretty much follow, no matter what version of Studio you’re on, but I make no promises.
Anyway, from within the Preferences window, go down to PHP (don’t click on PHP but rather open up the category) and then click on Servers, like so.
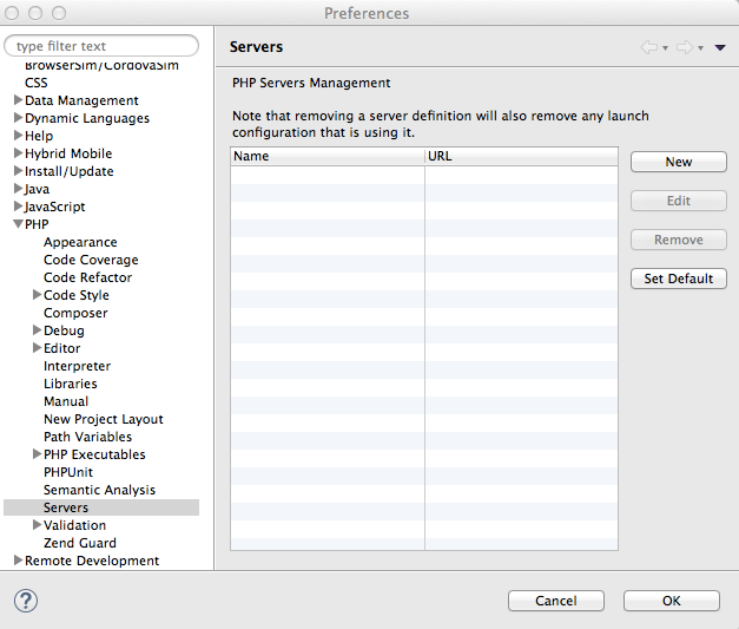
Figure 1: From the Preferences window, select Servers.
Once you’re in the Server window, click on New. When the new window opens, select Remote Zend Server and press Next.
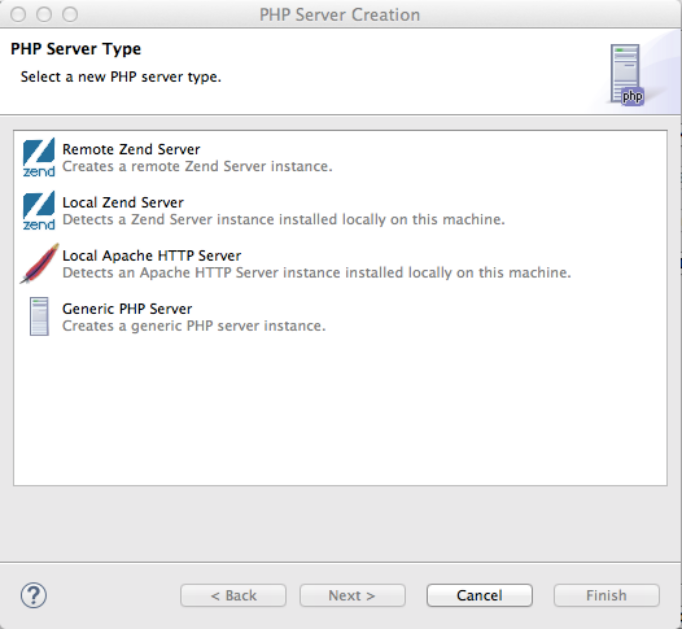
Figure 2: Select the Remote Zend Server option and press Next.
As if by magic, a wizard will appear. Key in whatever description for the remote server seems cool to you. Then in the Server Properties field, enter the URL for port 10080. That is, if your IBM i URL is 100.200.300.400, then what you would put in here would be http://100.200.300.400:10080. When you hit Next, the system will try to find that server. At some point, the Zend Server Credentials Sign On will pop up and you’ll need to enter the password. Make sure you have that handy.
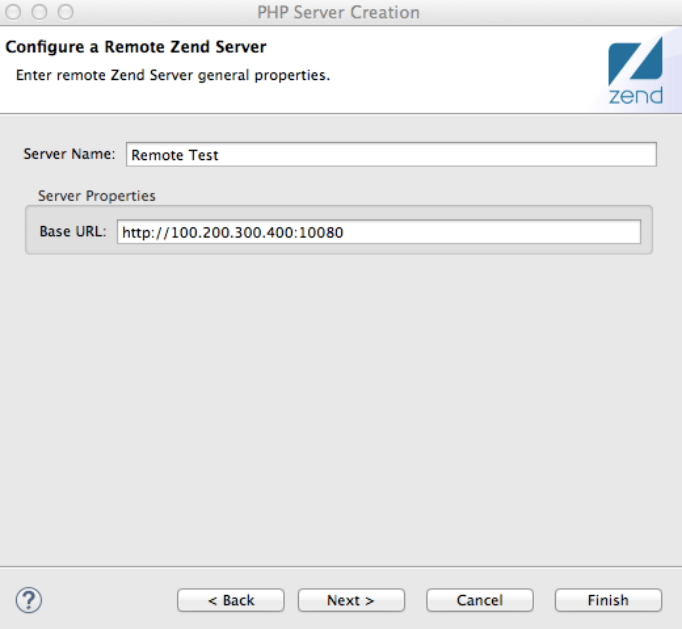
Figure 3: In this window, you set the Server Name and URL.
If the Document Root field happens to show up anywhere, it should be left empty.
Hitting Next will take you to the next window in this wizard. When you get to this screen, you select the debugger you’re planning to use, either the Zend Debugger or XDebug.
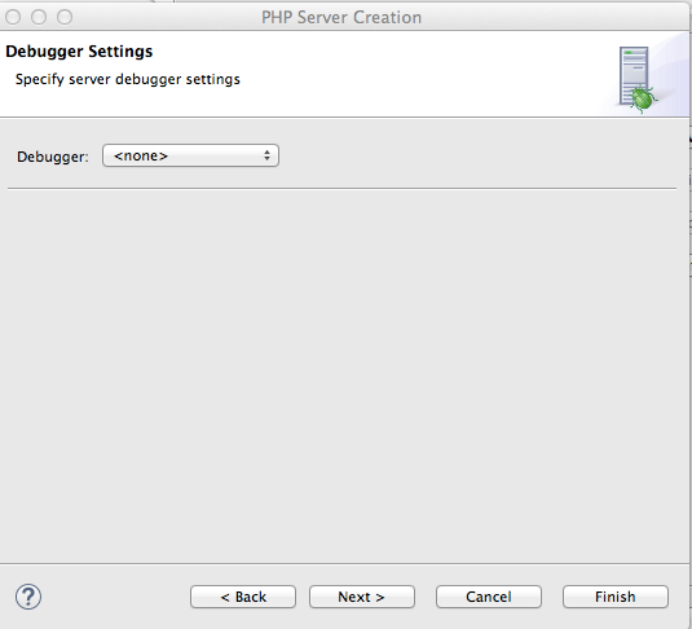
Figure 4: In the Remote Server wizard, select your debugger.
If you’re doing Automatic Upload with this server (that is, if you want to be able to either automatically or manually have the system push changes to your script out to the remote server), then you may select the connection profile that you want to use for this connection.
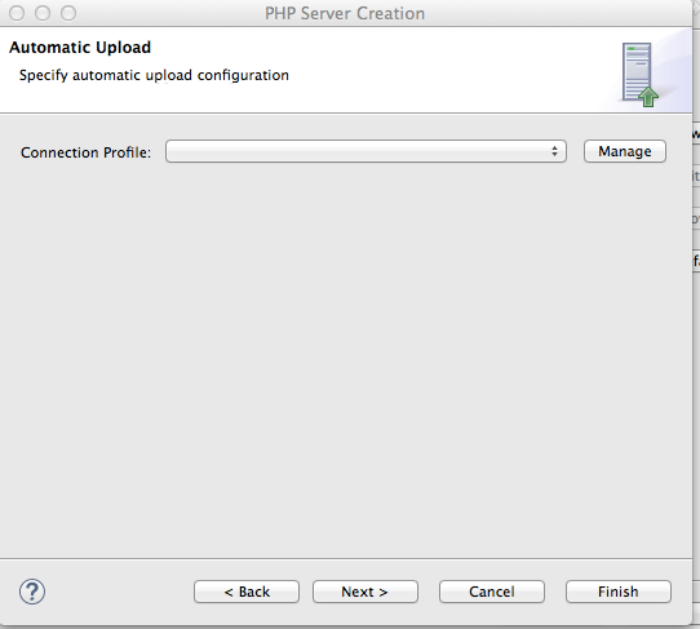
Figure 5: Set the connection for Automatic Upload.
And, if you want to set up SSH Tunneling, you do it in the screen shown below. A lot of people get real excited about that.
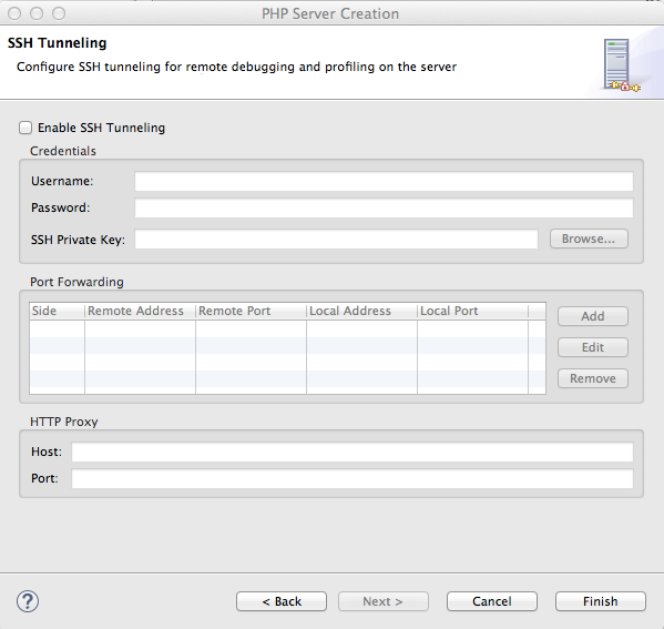
Figure 6: Set up SSH Tunneling.
Once you’re finished with this window, you should be able to go back to the Preferences > PHP > Servers window and see the server you just created. You may edit or delete it at any time using this facility.
PHP > Debug Setup
At this point, you still want to be in Zend Studio, in Zend Studio > Preferences (or maybe Window > Preferences). Within that, go to PHP > Debug.
What you want to do at this point is set the server you just created to the default. Unless you have only one. In that case, you don’t need to bother.
And make sure Break at First Line is checked.
Once that’s done, retrace your steps a bit and get into PHP > Debug > Debuggers. Within this window, highlight the debugger you’re going to use (Zend Debugger or XDebug) and click Configure.
In the window that comes up, make sure that the IP address of your PC is at the top of the list in the Client Host/IP field.
And that’s it. See how simple that was.
Check to See If Debugger Is Working
Only one thing left to do, and that’s to fire this baby up and take ‘er out for a test drive.
Start by picking a script you want to test. Even if this script is on your local machine (your PC), you must make sure it’s on the IFS in the folder /www/zendsvr6/htdocs/’script’.php.
Open it up in the PHP Explorer window. Right-click somewhere in that window, and then select Debug as > PHP Web Application.
That should open things up in the Debug perspective, and you can debug it from there, either going step by step or setting break points.
Trying It Yourself
So go ahead; give it a try. Below are a few resources that can help you with the setup. In case you don’t believe me. Or you did what I suggested you do but it didn’t work. You never know.
IBM i Example: Configuring Remote Debugging
Remote Debugging and Breakpoints


 Business users want new applications now. Market and regulatory pressures require faster application updates and delivery into production. Your IBM i developers may be approaching retirement, and you see no sure way to fill their positions with experienced developers. In addition, you may be caught between maintaining your existing applications and the uncertainty of moving to something new.
 IT managers hoping to find new IBM i talent are discovering that the pool of experienced RPG programmers and operators or administrators with intimate knowledge of the operating system and the applications that run on it is small. This begs the question: How will you manage the platform that supports such a big part of your business? This guide offers strategies and software suggestions to help you plan IT staffing and resources and smooth the transition after your AS/400 talent retires. Read on to learn:
LATEST COMMENTS
MC Press Online