Have you met the “new” ILE Debugger? Forget ISDB. The future of debug is here.
It’s really hard to write a complete and complex piece of code without a bug or two, so you’re probably no stranger to the Interactive Source Debugger (ISDB) that has served RPG programmers since V3R1. Now that you’re moving into the brave new world of ILE, it’s also time to upgrade your debugging skills. In this subseries, you’ll learn what you need to know to turn your time-consuming pains with ISDB into something more pleasant and efficient with ILE debugger.
The Interactive Source Debugger Versus the ILE Debugger
ISDB is an old tool. As I said before, it dates all the way back to V3R1, launched in 1994. It has a lot of limitations, forcing RPG programmers to include one or more forms of DIY debugging—things like sending messages when a certain routine is executed, writing useless (except for debug purposes) log records, and other inventive ways to overcome ISDB’s shortcomings. I’m sure you know at least a few of these limitations, but let’s go over the list and see how the new debugger compares to the old one:
- As the name implies, ISDB only lets you debug interactive programs, whereas ILE debugger also allows you to debug programs running in batch. (You’ll see how later in this series.)
- As you start working with ILE objects, you’ll see that ISDB is not able to handle them, while the new debugger can, well, debug both OPM and ILE programs.
- One of the main criticisms about ISDB is that it consumes a lot of resources without the expected output from that consumption—it’s a rather slow tool. The ILE debugger is the exact opposite: It’s really fast and has low overhead.
- Navigating in an ISDB session is complicated. It gets better with practice, but it’s clunky and not very intuitive. The new tool allows a much smoother navigation through simple commands and function keys that are flexible and easy to use.
This is why you should leave ISDB behind and embrace the new ILE debugger as soon as possible. Let me show you how to do it, step by step, starting with preparing your programs for the best possible debug experience.
Getting to Know the Different Debugging Views
It all starts when you compile your code. In ILE’s case, this means the CRTRPGMOD command, discussed way back in the beginning of the RPG Academy TechTip series. In that article, you learned that the DBGVIEW parameter was important and that you should, by default, use the *SOURCE keyword. Now that you know a little more about ILE, it’s time to learn about the other options available. I’ll provide a little more information about *SOURCE in a moment, and you’ll see that it’s not always the best option.
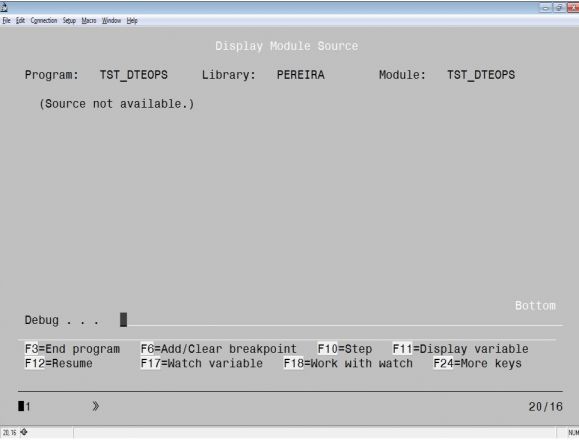
Let me begin with the lowest level of debug view: *STMT. This keyword simply allows you to display variables’ contents and set breakpoints at the statements’ locations using a compiler listing—no source is displayed in the debug screen. To obtain a compiler listing, you should specify OUPUT(*PRINT) in the CRTRPGMOD command. Note that a compiler listing is not exactly the same as you see in your source member. Even if your shop needs to debug programs in your customer’s production environments, and you think that using *STMT is the only way to have debuggable programs that don’t reveal your source code, don’t jump to conclusions. Hiding source in plain (debug) view is something I’ll talk about later. Figure 1 shows the Display Module screen for a module compiled with this keyword. Let me take a moment to apologize for the fixed-format code you’ll see, but I used a piece of code that wasn’t totally “modern” from the “BIF Up Your Code” subseries to illustrate this set of TechTips about the ILE debugger.
Figure 1: The Display Module screen for a module compiled with DBGVIEW (*STMT)
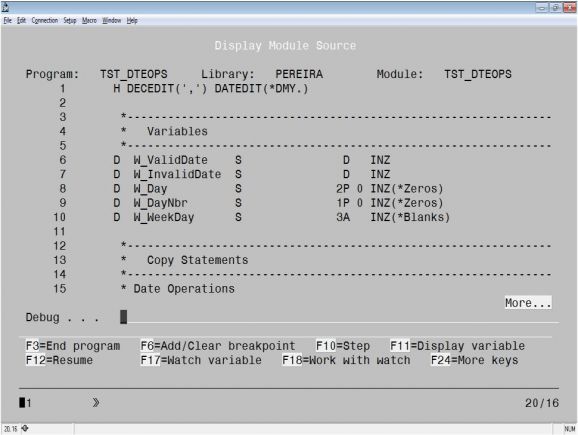
The *SOURCE keyword gives you source-level debug information, allowing you to display and reference a module’s source during the debug session rather than rely on a piece of paper (the compiler listing) with the statement numbers, which is, in a nutshell, what the *STMT keyword forces you to do. This option lets you see the actual statements being executed, just like they were written in your source member, and navigate through the source code while executing debug operations. Figure 2 shows an example of a Display Module screen for a module compiled with DBGVIEW(*SOURCE).
Figure 2: The Display Module screen for a module compiled with DBGVIEW(*SOURCE)
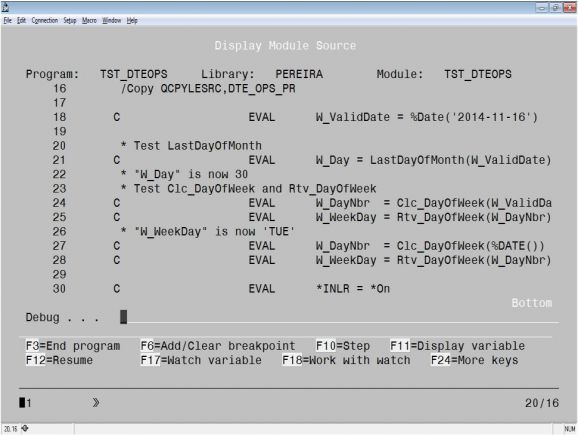
This view produces a slightly larger object than the *STMT keyword. It’s an improvement, but you still can’t see the sources of the copy members included in the source code using the /COPY or /INCLUDE statements. Instead, what you get is the /COPY or /INCLUDE statement as you wrote it in the original source, shown in Figure 3.
Figure 3: Copy members are not shown in the Display Module screen for a DBGVIEW(*SOURCE)-compiled module
These copy members typically contain prototype definitions for the procedures, but they can also hold definitions for variable and constant fields. It’s really annoying when you’re debugging something and you just can’t figure out where a variable comes from. (Admittedly, it gets easier if you use the appropriate prefixes, as discussed a few TechTips ago, but it’s still annoying not to see all the code that’s being executed.) In addition, only a reference to the source is stored with the object. Basically, only the source member, source file, and library names are stored. This keeps the object from growing significantly in size, but the source must not change and must not be renamed or moved. If you change the source, it will no longer match the object’s original source, and if you rename or move the source (which will happen if you use different sets of libraries for your development, quality assurance, and production environments), the debugger won’t be able to locate it.
If you need to see the copy members, then you need to use *COPY. This view lets you see the actual expanded code produced by copy members, rather than simply seeing a /COPY or /INCLUDE statement during the debug session. Note that using this keyword causes a slight increase in object size, when compared with the *SOURCE keyword.
More to Come
That’s all the space I have this time around! In the next RPG Academy TechTip, I’ll continue to discuss the debug views that the ILE Debugger has and share some advice on how to choose the most appropriate. Until then, feel free to share your ideas, comments, questions on the Comments section or in the usual LinkedIn groups where my articles usually pop up.


 Business users want new applications now. Market and regulatory pressures require faster application updates and delivery into production. Your IBM i developers may be approaching retirement, and you see no sure way to fill their positions with experienced developers. In addition, you may be caught between maintaining your existing applications and the uncertainty of moving to something new.
 IT managers hoping to find new IBM i talent are discovering that the pool of experienced RPG programmers and operators or administrators with intimate knowledge of the operating system and the applications that run on it is small. This begs the question: How will you manage the platform that supports such a big part of your business? This guide offers strategies and software suggestions to help you plan IT staffing and resources and smooth the transition after your AS/400 talent retires. Read on to learn:
LATEST COMMENTS
MC Press Online