Now that you know nearly all the theory needed to perform an efficient debug session, let me guide you on a step-by-step debug session.
Written by Rafael Victoria-Pereira
If you haven't done so, download and restore the programs created back in the "BIF Up Your Code" subseries, as they"ll be used for this guided debug session. You can find the respective save file here.
As mentioned a couple of TechTips ago, you might need to recompile the TST_DTEOPS module with the appropriate DBGVIEW keyword to get the debug view that you prefer. Personally, I like to use either *SOURCE or *LIST; for this example, I'll go with *SOURCE. Compiling modules should be familiar by now, but if you have any questions, refer to chapter 7 of IBM's ILE Programmer's Guide, Creating a Program with CRTRPGMOD and CRTPGM. There, you'll find everything you need to know about module compilation.
When you're ready, type the following command and press Enter:
STRDBG <MYLIB>/TST_DTEOPS
Note: Replace <MYLIB> with the name of the library to which you restored the save file.
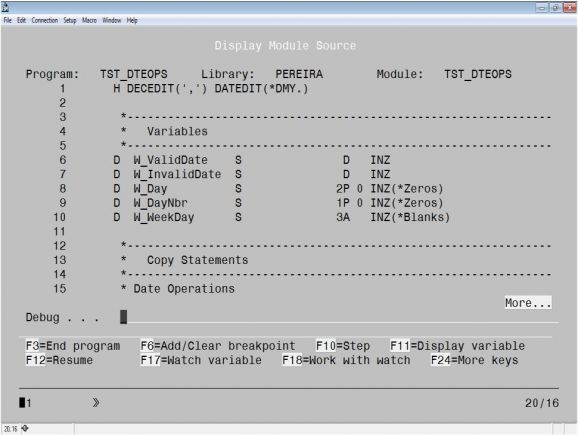
A Display Module screen similar to Figure 1 will be displayed. Now let's add a couple of breakpoints. I also want to add a watch, but, as I explained in a previous TechTip, the program must exist in the call stack (i.e., the program must be running) before you can add watches for its variables.

Figure 1: The Display Module Source window
Let's add a conditional breakpoint to line 21 and an unconditional one to line 24. For simplicity's sake, I'll start with the latter. As you know, there are a few different ways to add an unconditional breakpoint:
- Position the cursor in the appropriate line and press F6.
- Type BREAK followed by the line number in the debug command line.
- Add a breakpoint via option 1 of the Work with Module Breakpoints screen.
Let's use the F6 key.
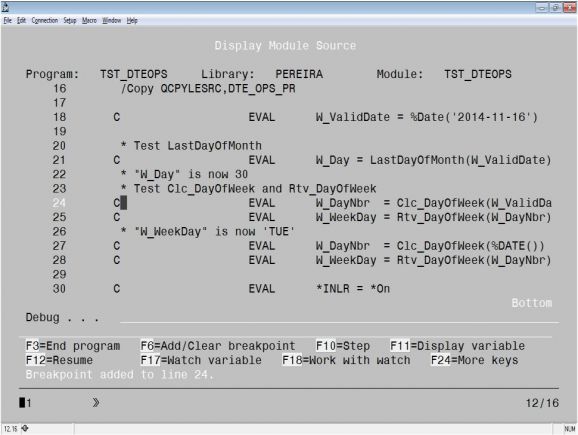
Position the cursor in line 24 and simply press F6. You'll see that the line number on the left side of the screen is highlighted, and there's a message at the bottom of the screen saying that a breakpoint was added to line 24. This is shown in Figure 2.

Figure 2: An unconditional breakpoint is added to line 24.
That was easy, right? Now, let's create a conditional breakpoint. The F6 solution won't work because you need to specify the condition. This solution doesn't allow you to do that, so let's use the command line instead. Figure 3 shows the required command.

Figure 3: Add a conditional breakpoint via the debug command line.
Now press F12 to leave the Display Module screen, and call the TST_DTEOPS program via the command line by typing CALL TST_DTEOPS and pressing Enter.
The execution stopped in line 21. Remember that the breakpoint is activated before the line in which it resides is processed. This means that if you display W_Day's contents, either by positioning the cursor on top of the variable and pressing F11 or by typing EVAL W_Day in the debug command line and pressing Enter, you'll see that the work variable contains zero.
Now let's see how the LastDayOfMonth function works, shall we? To do that, I'll press F22 to drill down into the function - that's "step into" in debug lingo. A new module source is displayed, in this case the DTE_OPS' module. I can force a step-by-step execution by pressing F10 once per statement. (Note that it's not one per line, because a statement, especially in free-format, can span multiple lines.) Alternatively, I can place the cursor over a variable and show its contents by pressing F11. I can also perform these operations using the STEP and EVAL debug commands, respectively. Go ahead, play around a bit! When you're done, use F12 to resume execution. Because an additional breakpoint was created for line 24 of TST_DTEOPS, the execution will stop on that line.
Now, let's add a watch to the W_DayNbr work variable. There are three ways to perform this task:
- Place the cursor on top of the variable and press F17.
- Type WATCH W_DayNbr in the debug command line.
- Press F18 to display the Work with Watch screen and use option 1, followed by the variable name that should have the watch.
Once that's done, press F12. The execution will stop immediately, because the code that line 24 executes changes W_DayNbr's contents.
You probably remember that all the debug line navigation commands presented earlier in this subseries had abbreviated forms. So does EVAL; simply type EV W_DayNbr and press Enter. You'll see that the variable now contains the number 30. Press F12 to resume execution; the program will end, and you'll be back in the system command line. Note that your debug session was not terminated. It will stay active until the job (in this case, the interactive session) ends or until you issue the ENDDBG command.
We'll get back to another round of guided debug in the next TechTip so that you can get a handle on a few more debug tricks. Until then, well, you know the drill: comment, ask, criticize in the Comments section below!


 Business users want new applications now. Market and regulatory pressures require faster application updates and delivery into production. Your IBM i developers may be approaching retirement, and you see no sure way to fill their positions with experienced developers. In addition, you may be caught between maintaining your existing applications and the uncertainty of moving to something new.
 IT managers hoping to find new IBM i talent are discovering that the pool of experienced RPG programmers and operators or administrators with intimate knowledge of the operating system and the applications that run on it is small. This begs the question: How will you manage the platform that supports such a big part of your business? This guide offers strategies and software suggestions to help you plan IT staffing and resources and smooth the transition after your AS/400 talent retires. Read on to learn:
LATEST COMMENTS
MC Press Online