With the wide breadth of Web application servers available today, you need to have some facility for discerning which products are the fastest. Further, once you set up a Web application, you want to be sure that the Web site continues to perform adequately. There are a number of products available that allow you to stress-test your Web server and your Web applications. Many of these products are expensive, but the one that I’m going to tell you about is free. In fact, it is so free that it is an open source project known as JMeter, which is available from the Apache Software Foundation.
JMeter is an open source all-Java product that allows you to automatically test the performance of Web applications. Basically, JMeter iteratively performs URL requests to one or more Web sites and accumulates the response data for later review. JMeter also provides a number of graphical charts, such as bar charts and line graphs, so that you can more easily review the test results.
Installation
You can get your copy of JMeter from http://java.apache. org/jmeter/index.html. You can read more about JMeter on its home page but, for now, select the Download hyperlink. That will take you to the Apache JMeter Distribution page, where you select the ApacheJMeter_1.5.zip hyperlink to begin the download. Once the program is downloaded, use a version of the zip compression utility (a trial of WinZip is available at www.winzip.com) to extract the ApacheJMeter_1.5.zip file. The zip utility will create a JMeter directory with subdirectories of bin, docs, and src. Notice I said it’ll create a directory named src; that stands for source, and, yes, JMeter is an open source product, so you get JMeter’s complete source. If you look in the bin directory, you’ll see the jmeter.bat file. This is the file you must execute to start JMeter. If you execute that batch file without the next couple of configuration steps, you’ll probably get Java errors. That’s because JMeter requires that you have Sun’s JavaMail on your system and that it’s qualified on the Java classpath environment variable. Therefore, if you do not yet have JavaMail, you’ll need to download it. You can download the JavaMail zip archive from http://java. sun.com/products/javamail. When you extract the zip, you will have a directory called javamail-1.1.3, under which you’ll find a file called mail.jar. The easiest way to add mail.jar to your classpath is to edit the jmeter.bat file and append the full qualification of
mail.jar to the -cp option of the Java command. So java -cp %CLASSPATH%; ApacheJMeter.jar becomes something like java -cp %CLASSPATH%; ApacheJMeter.jar;D:Javajavamail-1.1.3mail.jar, where D:Java is the drive letter and path you extracted the JavaMail file to.
You’ll also have to make sure that your PC has the Java Development Kit (JDK)
1.2 or 1.3 installed, because JMeter uses the Java Foundation Classes (JFC) GUI components, new with JDK 1.2. You can get the latest JDK from http://java.sun.com. One final note: You may have to increase the size of the environment space in the DOS session that the jmeter.bat file runs in. Many 95/98 systems do not have enough environment space allocated to accommodate the environment variables added by jmeter.bat.
Gauging Performance
JMeter comes with a Windows batch file called jmeter.bat and a UNIX/Linux shell script called jmeter.sh, which you can use to bring up the JMeter GUI. But before you attempt to use the startup command, be sure to do the minor setup and configuration steps covered earlier. Given appropriate configuration, however, the JMeter script should bring up the JMeter GUI, from which you can start stress-testing Web sites. You can use JMeter to test Web servers in one of three ways: by entering a URL, through Java Database Connectivity (JDBC) connections, or by hitting an unlimited number of HTTP requests with a variety of parameter settings. The easiest way to become familiar with JMeter is to use its Sampler panel’s default of Simple HTTP Tester, as shown in Figure 1, and then qualify your Web site in the URL prompt. The Timers panel, shown at the bottom of the screen in Figure 1, lets you select how long of a delay, in milliseconds, you want between the JMeter hits to those Web sites. You can opt to use a random delay with a Gaussian distribution (which uses empirical rules of standard deviations to approximate real-world Web access), a random delay and a uniform distribution, or simply a constant delay. If you don’t know what a Gaussian distribution is, simply use a constant delay.
You can watch the graphical results of the JMeter data collection in a variety of dynamic screen formats such as spline curves or dot plots. I find it more convenient, however, to use the JMeter option of writing the results to a file and then reviewing them later. Note that JMeter also has options that allow you to review the Web application’s textual response to JMeter’s automated URL request, and you can even have the results emailed to you (which is a nice way to automate performance tests on a production Web site). At any rate, what I suggest is that you write the samples to a data file. To write the samples, select the Run tab and then type the name of an output file in the Actions panel (see Figure 2). I suggest that you put the file in JMeter’s testsamples subdirectory and use a suffix of .data. After you’ve clicked the Open button, you can finally start collecting data by selecting Start in the Run menu. Let JMeter collect data for 5 to 10 minutes before stopping it with the use of the Control key and period (Control-.) accelerator keystroke. (You may find that you have to do this several times before JMeter acknowledges the termination request.) At this point, you can write the sample data to your file by clicking on Flush and then Close on the Actions panel.
With the data written to a file, you can review the results graphically by selecting the Analyze Data File menu option in the Reports menu. After you’ve qualified the data file—you can use the browse dialog to select your data file—a nice graph of the test results, such as the one shown in Figure 3 (page 64), will be displayed. Note that the black line charts the number of milliseconds it took for Midrange Computing’s Web site to respond to the 81 home page requests.
WebLogic vs. Tomcat
The Simple HTTP Tester default of the Samplers panel (see Figure 1) allows you to test a single Web site using only one URL and query string. But, if you choose the Advanced HTTP Tester twirly option, then you can qualify as many URLs as you want. You might
want to test the same Web site but with varied query strings. You can configure JMeter to iterate through a list of server programs, to simulate random use of an application. But you can also test several Web application servers and then graphically display a comparison. To test JMeter’s comparison capabilities, I ran a test comparing the Apache Software Foundation’s Tomcat with BEA’s WebLogic, the result of which is shown in Figure 4. The black lines in Figure 4 show the milliseconds it took for WebLogic to respond to the 342 JavaServer Page (JSP) requests whereas the blue line shows Tomcat’s response time. A quick look at Figure 4 suggests that, for this test case, the response time of Tomcat and WebLogic are relatively similar. To set up that test, I had to create the Tomcat and WebLogic Web Page Test Samples, shown in Figure 5, by clicking on the Create New Test Sample icon (the sheet of paper with the little snowflake on it). Clicking on that icon brought up the URL Test Parameters dialog, shown in the center of Figure 5. The URL qualified a simple JSP called JSP400.jsp (see “Bridge the Gap to Java with JSP,” in the May 2000 issue of Midrange Computing) that retrieves a JDBC result set of approximately a dozen records. Had I used a JSP, servlet, or CGI that required arguments, I could have specified a list of query parameters with this panel. Note that on both the Tomcat and WebLogic test samples, I selected the Interleave option. By doing so, JMeter alternates hits on each Web application server. That is, first it will connect to the Tomcat server and then to the WebLogic server and then back to the Tomcat server, and so on. After that, I executed the test in the same way I did using the Simple HTTP Tester example.
Beyond JMeter
There are other products available for stress-testing Web sites, but JMeter is free. If you find that JMeter’s graphical displays aren’t sophisticated enough, you don’t have to buy a different product; you can just extend JMeter. Perhaps the coolest thing about JMeter is that, like the Apache Software Foundation’s flagship Apache product, it’s extensible. JMeter was developed using the standard object-oriented programming technique of inheritance. JMeter has five extensible object types: Timers, SamplerControllers, Samplers, TestSamples, and Visualizers. And, because of the nature of the Apache license, other developers will undoubtedly be creating extensions that will become available to everyone. Regardless, the base JMeter tool is a handy way to add some controlled stress to your job as a Web developer.
REFERENCES AND RELATED MATERIALS
• Apache JMeter Web page: http://java.apache.org/jmeter/index.html
• BEA Systems Web page: www.beasys.com
• Jakarta Tomcat Web page: http://jakarta.apache.org/tomcat
• Sun’s JavaMail API Web page: http://java.sun.com/products/javamail
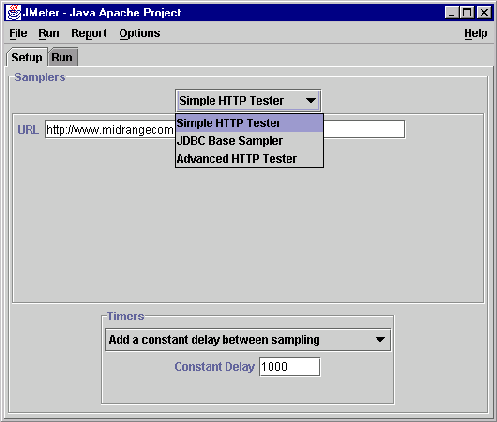
Figure 1: The easiest way to use JMeter is to ask it to hit one URL at specified intervals.
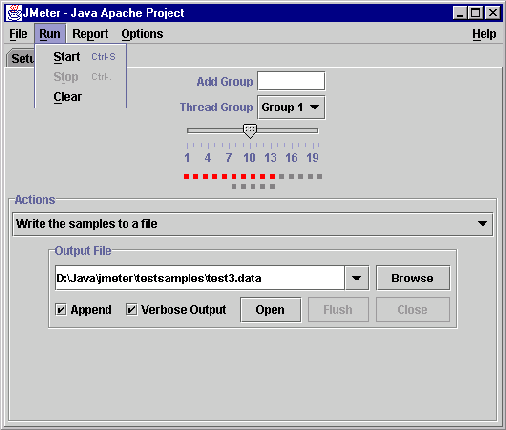
Figure 2: The data that JMeter collects can be viewed dynamically in a GUI or saved to a file for later analysis.
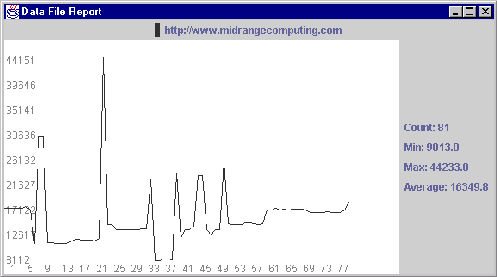
Figure 3: The data from JMeter collection files can be displayed in a graph.
Figure 4: By using JMeter’s Advanced HTTP Tester, you can compare the performance of several Web application servers.
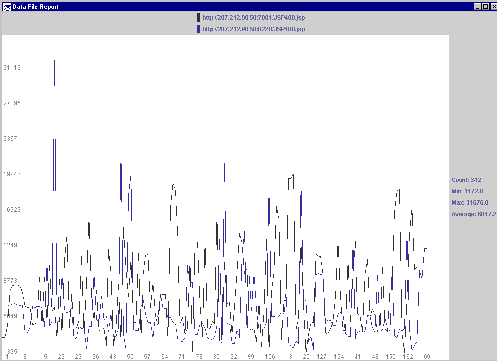
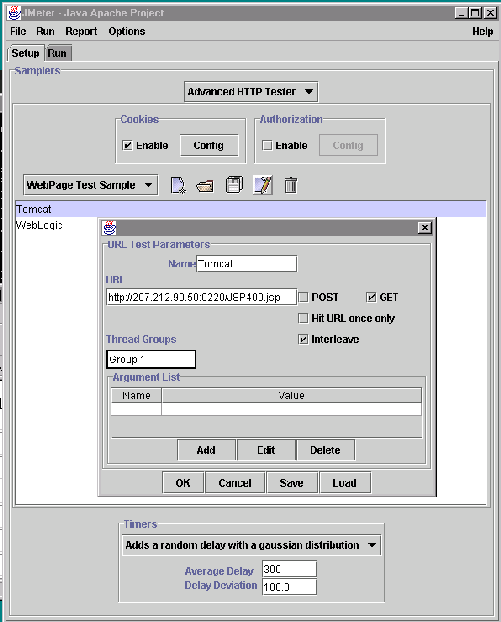
Figure 5: JMeter’s URL Test Parameters lets you set up any number of URLs with optional query strings.


 Business users want new applications now. Market and regulatory pressures require faster application updates and delivery into production. Your IBM i developers may be approaching retirement, and you see no sure way to fill their positions with experienced developers. In addition, you may be caught between maintaining your existing applications and the uncertainty of moving to something new.
 IT managers hoping to find new IBM i talent are discovering that the pool of experienced RPG programmers and operators or administrators with intimate knowledge of the operating system and the applications that run on it is small. This begs the question: How will you manage the platform that supports such a big part of your business? This guide offers strategies and software suggestions to help you plan IT staffing and resources and smooth the transition after your AS/400 talent retires. Read on to learn:
LATEST COMMENTS
MC Press Online