But building your data is only half of the equation. Once the data is in your new database, you'll need some way to get it back out. In this article, I'll examine options for retrieving data from Analysis Services. I'll also explain how to increase performance when building your OLAP database by transferring the data to a SQL Server database and how to schedule your data transfers using SQL Server Agent.
Transforming Data
In the first article, I created an OLAP database that was built directly from data on the iSeries using an ODBC data source. While this technique is very convenient, it also takes much longer to process the data when the database is connected directly to the iSeries. You can greatly decrease the amount of time required to build your OLAP database by basing it on an SQL Server database. The problem, however, is that the data resides on the iSeries. That's where Data Transformation Service (DTS) comes in.
DTS packages are equivalent to data transfer definitions within Client Access Express. The big difference is that DTS packages allow you much greater control over what happens as the data is transferred from the source database to the destination database. I should also mention that, although DTS is part of SQL Server 2000, it will allow you to transfer data from just about any ODBC- or OLE DB-compliant data source to just about any ODBC- or OLE DB-complaint data source. This makes it a great tool for use outside the scope of this article. For now, though, I'll examine the steps required to replicate data from the iSeries down to an SQL Server database.
Before you can import data from the iSeries to an SQL Server database, you need to create the database. This part is pretty painless. Simply launch the SQL Server 2000 Enterprise Manager, navigate to your SQL Server from the management console, and expand the tree. Next, right-click on the Database folder and select New Database. Now, name your new database, and you're ready to create your DTS package.
The easiest way to create a new DTS package is to right-click on your new database and select Import Data from the context menu. This will display the DTS Import/Export Wizard, which will actually create a DTS package for you. The first portion of this wizard, shown in Figure 1, is used to define the source database.
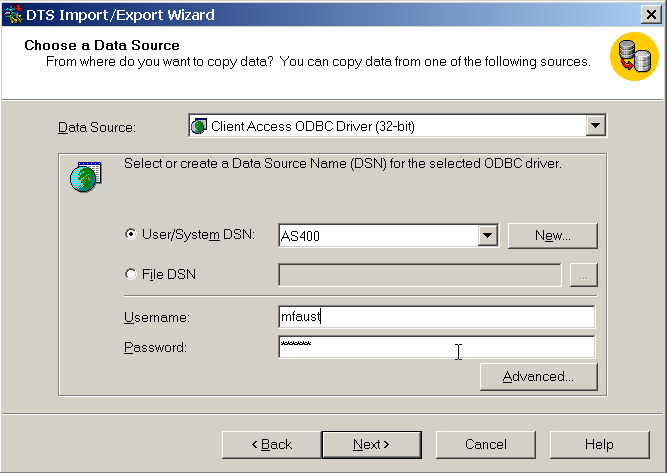
Figure 1: This window is used to define the source database. (Click to enlarge.)
Select the Client Access ODBC driver from the Data Source drop-down list. If you already have an ODBC data source defined for your iSeries, select it from the User/System DNS drop-down list. Otherwise, click on the New button to create a new ODBC data source.
Be sure to enter a valid user name and password for your iSeries. This password will be saved within the DTS package, so keep that in mind when deciding what user ID to use. You could have problems down the road if you change the password for this user ID without updating the DTS package.
After clicking Next, you'll be prompted to define the destination database. This screen should look similar to the previous screen. Since you took the Import Data option from a context menu on your new database, you won't need to change any of the information on this screen. Click Next one more time to display the screen in Figure 2.
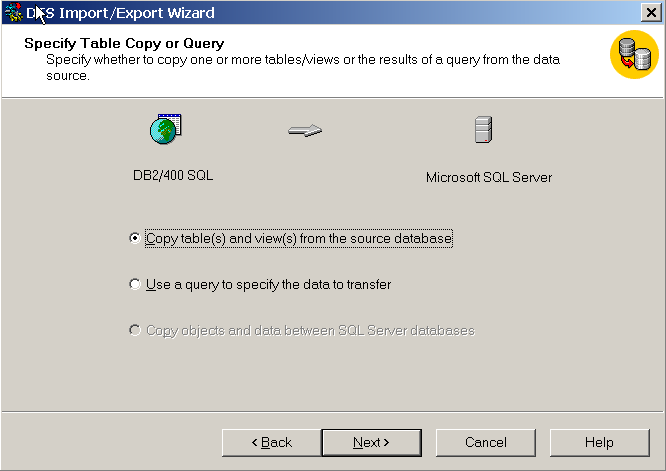
Figure 2: Use this screen to define how source data will be selected. (Click to enlarge.)
You have two options for how to get the data out of your source database. The first option, "Copy table(s) and view(s) from the source database," allows you to select entire files from the iSeries and transfer them to SQL. The second option, "Use a query to specify the data to transfer," is much more powerful. This option lets you create a standard SQL statement to retrieve records from the source database. This means that you can select only the required fields, retrieve only desired records, or even create your destination database using data from multiple files on the iSeries. The third option, which is grayed out here, is for transferring objects between SQL Servers. For this example, select the middle radio button and click Next to display the screen shown in Figure 3. 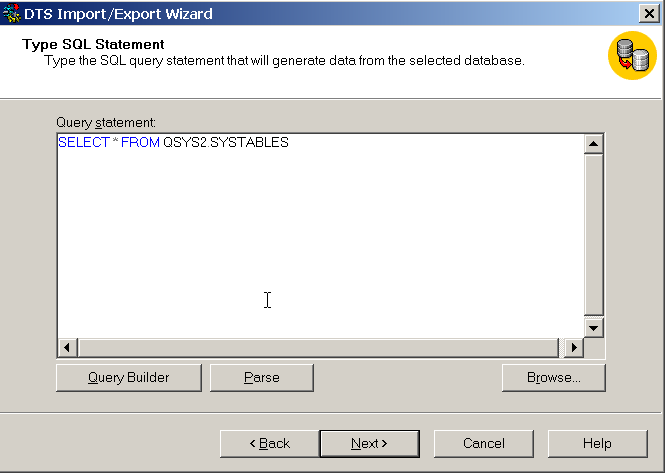
Figure 3: You can type an SQL Select statement into this window. (Click to enlarge.)
Through this screen, you provide an SQL SELECT statement to retrieve data from your source database. The Query Builder button will step you through the process of creating the SQL statements without having to enter them manually. For this example, just enter the statement shown here:
After keying in the statement, click the Parse button to verify that the SQL syntax is valid. Then, click Next. The wizard will display the screen shown in Figure 4.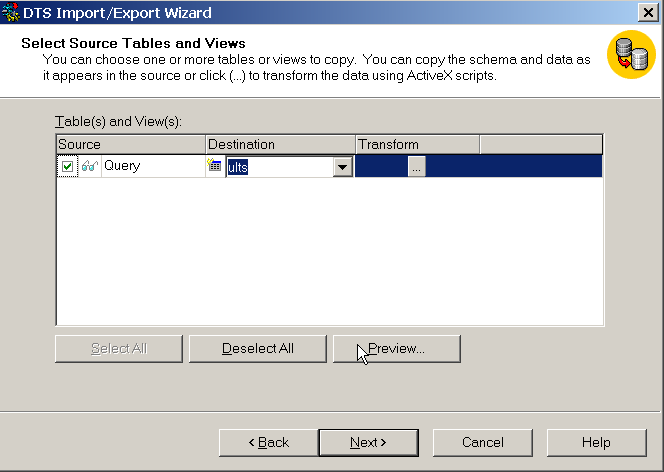
Figure 4: The destination table is selected from this screen. (Click to enlarge.)
From this screen, you can do several things. You can select which table in the destination database will receive the requested data. You can click on the "..." button under the Transform column to define how data is moved from the fields in the source database to the fields in the destination. You can also click on the Preview button to display some sample data from the source database.
Change the destination table name to FILES and click Next. (Since you are creating a new table, you won't need to change the field transformations right now.) The screen presented will allow you to run, schedule, and save the newly created DTS package. By selecting the "Schedule DTS package for later execution" check box, follow by the build (...) button on the right side of the screen, you can easily add a schedule entry for this package into the SQL Server 2000 Agent, which is the SQL Server equivalent of OS400's job scheduler. This is great for situations in which you want to download the data into SQL Server on a regular basis.
You have four options for where to save your DTS package if you choose to save it.
- SQL Server--The package is saved to the SQL Server and can be found under Data Transformation within the Local Packages folder.
- SQL Server Meta Data Services--The package is saved to Meta Data Services, which allows for greater tracking of package version as well as historical information about the data controlled by the package. To use this option, you must have Meta Data Services installed on your SQL Server.
- Structured Storage File--The package is saved in a file outside of the SQL database. This option makes the package portable across your network and allows multiple versions of a package to be stored within one file.
- Visual Basic File--This option generates a Visual Basic (VB) module in a .bas file that will perform the data replication. This is a nice option if you are familiar with VB and want to be able to easily modify a package after creation.
After making selections on this screen, click Next to get to the final screen, and then click Finish. Your DTS package will be saved and/or executed according to the options you selected.
That's really all there is to it. Now, you have a duplicate copy of your iSeries data available within an SQL Server database. You can now follow the steps used in Part I of this article, with slight modification, to create an OLAP database. The only change that must be made is that you need to use the SQL Server 2000 as your data source in place of the Client Access ODBC driver. The result will be that the OLAP database will take much less time to build.
Using OLAP Data
In Part I of this article, you learned how to create an OLAP database using Analysis Services. You've already discovered how to make the data friendlier to Analysis Services by porting it into SQL Server. Now that you have the data in an OLAP database, I'll explain how to get the data back out.
You have a few options here. The first and probably easiest way to get data out of your OLAP database is to read the data into an Excel PivotTable. To do this, launch Excel and select Get External Data from the Data menu and then select New Database Query from the submenu. Click on the OLAP Cubes tab from the dialog box, as shown in Figure 5.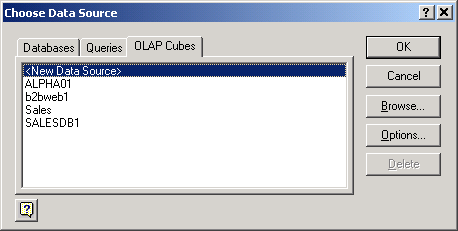
Figure 5: You can import data from an OLAP cube into Microsoft Excel. (Click to enlarge.)
Double-click on the New Data Source option within the list. For this example, you'll use the Food Mart sample database that is included with Analysis Services. Type Food Mart for the name of your new data source and select the appropriate OLAP provider from the drop-down list. Now click Connect. Make sure that the Analysis Server radio button is selected and provide the name or IP address of your OLAP server in the box provided. Click Next. Now, select the FoodMart 2000 database from the list displayed and click Finish.
You'll be returned to the Create New Data Source dialog. Select the Sales cube from the drop-down list at option 4 on the screen and click OK. When the Choose Data Source dialog is redisplayed, select your newly created Food Mart database and click OK. You will be returned to Excel, and the PivotTable and PivotChart Wizard screen will be displayed. Click on the Layout button to define the rows, columns, and data for your PivotTable (see Figure 6). 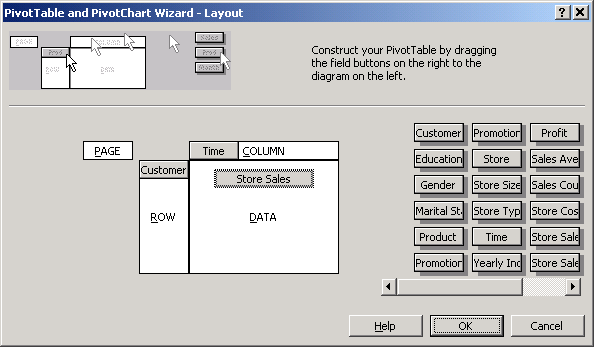
Figure 6: Use this screen to format your PivotTable. (Click to enlarge.)
First, drag the Customer dimension to the Row section of the PivotTable. Next, drag the Time dimension to the Columns section. Finally, drag the Store Sales measure to the Data section and click OK and then Finish. The data will be retrieved from your OLAP database into the PivotTable. You can easily expand a given dimension by double-clicking on it. Figure 7 shows the finished Excel PivotTable.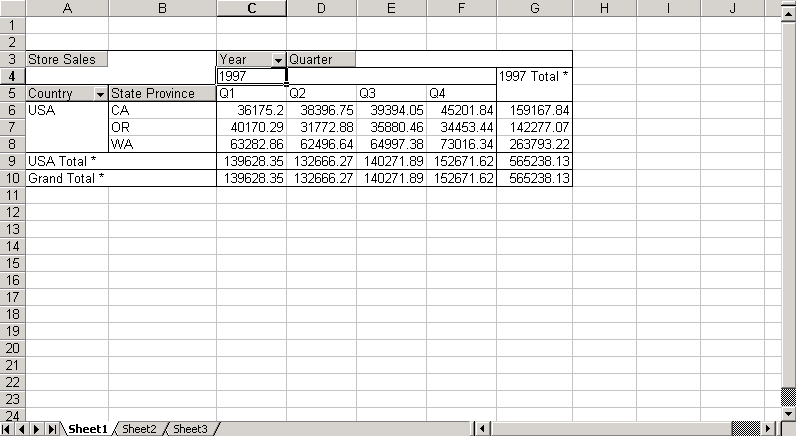
Figure 7: This is your finished PivotTable using OLAP data. (Click to enlarge.)
This is a great way to manipulate the data from your OLAP database without having to create an application. However, if your users aren't "Excel savvy," this may not be an option. In that case, you can fairly easily create applications that display the data from the OLAP database within a Web browser.
Data from an OLAP database can be read from VBor VBScript. To do this, use a subset of ActiveX Data Object (ADO) functions specifically designed for use with a multi-dimensional database. ADOMD works in much the same way that ADODB works. There are a few exceptions. First, with ADODB, you define the connection to your database using the CONNECTION object. With ADOMD, this is done through a COLLECTION object. The following VB Script statements would create the connection to the Food Mart database:
Set rst=Server.CreateObject("ADOMD.CellSet")
conn.ActiveConnection = " Provider=MSOLAP ;Data Source=OLAPSRVR " & _
";Initial Catalog=FoodMart;"
If you've used ADO in the past, you'll immediately notice the similarities. The cellset object within ADOMD is equivalent to an ADODB.Recordset object. This will contain the actual data from your OLAP database. However, because of the complexity of an OLAP database, you cannot use standard SQL to define what data is to be retrieved. In place of SQL, use a Multidimensional Query (MDX). While MDX is similar to SQL, there are some important differences. Below is a sample MDX query statement.
NON EMPTY {[Customers].Children]} ON ROWS
FROM Sales
WHERE {[Time].[1997]}
This sample will return the first level under the Customer dimension as rows and will return all of the measures as columns. The WHERE clause is used here to retrieve only data where the [Time] dimension is [1997].
In the example above, notice that I used two MDX functions within the statement (.Members and .Children). The table below gives a list of common MDX functions and how they are used.
| Function | Description |
| Children | Returns all items at the level directly below the specified level. Example: [Country].[USA].Children would return: [Country].[USA].[Alabama] [Country].[USA].[Alaska] etc. |
| Descendants | Returns all items at any levels below the specified level. Example: DESCENDANTS([Country].[USA]) would return: [Country].[USA].[Alabama] [Country].[USA].[Alabama].[Auburn] [Country].[USA].[Alabama].[Birmingham] [Country].[USA].[Alaska] [Country].[USA].[Alaska].[Anchorage] etc. |
| Parent | Returns the item at the level directly above the specified level. Example: [Country].[USA].[Alabama] would return [Country].[USA] |
| Members | Returns the set of all members in the specified dimension. Example: [Country].Members would return: [USA] [CANADA] [MEXICO] etc. |
| LastPeriods | Retrieves data for a specified number of periods backward from the period specified. This function is generally designed for use with a Time dimension but can be used with other dimensions as well. If used with a dimension that is not a time dimension, it will read back the specified number of items within the current level. Example: LastPeriods(4, [Time].[1997].[4]) would return data for the first 4 periods of 1997. If a negative number is specified, the function will read ahead by that number. Example: LastPeriods(-4, [Time].[1997].[4]) would return data for periods 5-8 of year 1997. |
Figure 8: Here's a sampling of MDX query functions.
This is a very small sampling of the MDX functions available. For a complete list, see the Analysis Services Programming guide included with SQL Server 2000.
Now, to get your data out of the database and into a Web page, you need to incorporate the ADOMD and MDX functionality into an Active Server Page (ASP). Save the code for OLAPTEST.ASP shown in Figure 9 into the InetPub/wwwroot folder on a machine running Microsoft Internet Information Server (IIS).
|
Figure 9: This Active Server Page will display data from our OLAP database.
This example first defines the Catalog and Cellset objects as explained earlier. When using the ADOMD.Cellset collection, you'll notice references to Axes and Positions. The AXES collection is used to identify which axis to read; for example, Axes(0) refers to the columns within the MDX query, while Axes(1) refers to the rows. The POSITIONS collection is used to reference an individual item within the defined axis; for example, Rst.Axes(0).Position(3) refers to the fourth column within the MDX query.
Remember that the items within the collection are base 0, so the first row would be Position(0), the second row would be Position(1), and so on. You can also reference an individual cell within your cellset by using the format Rst(Column, Row). Since this example uses the DESCENDANTS function within the MDX query, Rst(0,I).Positions(1).Members(0).LevelDepth is used to determine how many levels deep the value of the first column on the current row is. Position(1) is specified to retrieve the level for the row from the MDX query rather than the column. Also, in this example, Rst(V,I).FormattedValue is used to retrieve values from the defined cellset and format the value as defined within the OLAP cube. Figure 10 shows a sample of what the ASP output will look like. 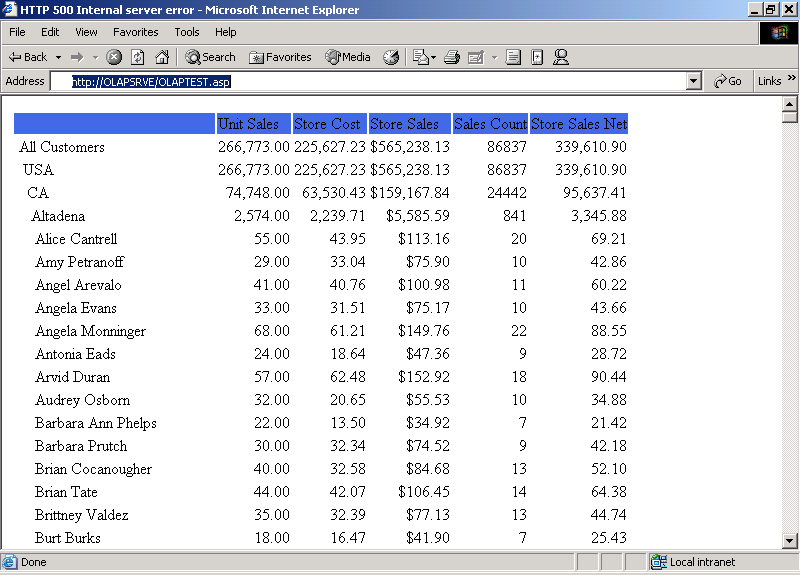
Figure 10: The OLAP data within an ASP looks like this. (Click to enlarge.)
As you can see, you are able to read and display the data on a Web page with only a small amount of code. The process is similar to what you would use to read and display data using ADO and OLE DB or ODBC. By changing a few lines in this example, you can allow a user to "drill down" from one level to another. First, you need to change the MDX query statements in the earlier example to those shown below.
" NON EMPTY " & Level & " ON ROWS ".Children & _
" FROM Sales "
Next, add the following statements to the beginning of the VBScript, as indicated by '


 Business users want new applications now. Market and regulatory pressures require faster application updates and delivery into production. Your IBM i developers may be approaching retirement, and you see no sure way to fill their positions with experienced developers. In addition, you may be caught between maintaining your existing applications and the uncertainty of moving to something new.
 IT managers hoping to find new IBM i talent are discovering that the pool of experienced RPG programmers and operators or administrators with intimate knowledge of the operating system and the applications that run on it is small. This begs the question: How will you manage the platform that supports such a big part of your business? This guide offers strategies and software suggestions to help you plan IT staffing and resources and smooth the transition after your AS/400 talent retires. Read on to learn:
LATEST COMMENTS
MC Press Online