New enhancements simplify the debug of SQL routines.
IBM first improved the debugging of SQL stored procedures, functions, and triggers way back in the V5R2 release when it introduced the *SOURCE debug view. This debug view allowed IBM i developers to debug their original SQL source code instead of having to debug the ugly C code that DB2 for i generates behind the scenes for SQL routines.
While the *SOURCE debug view greatly simplified things for developers, there were a couple of issues with this support that slowed down developers. First, the Step command often worked differently than with traditional IBM i programs. The Step command would have to be requested multiple times for a single SQL statement because it often takes multiple lines of C code to implement a single SQL request. Second, the EVAL command could not directly reference SQL variables; the variable name always needed to be qualified with a label (e.g., EVAL mylabel.VAR1).
The good news is that the recent Technology Refreshes for the IBM i 7.1 and 7.2 releases have finally eliminated these debug headaches for SQL routines. The following SQL stored procedure example will be used to help you better understand these recent enhancements.
CREATE PROCEDURE debug_test(IN p1 INT, OUT p2 INT)
LANGUAGE SQL
SET OPTION DBGVIEW=*SOURCE
BEGIN
DECLARE v1 INT;
SET v1 = (SELECT COUNT(*) FROM projects);
IF v1 > p1 THEN
SET p2 = 0;
ELSE
SET p2 = 100;
END IF;
END
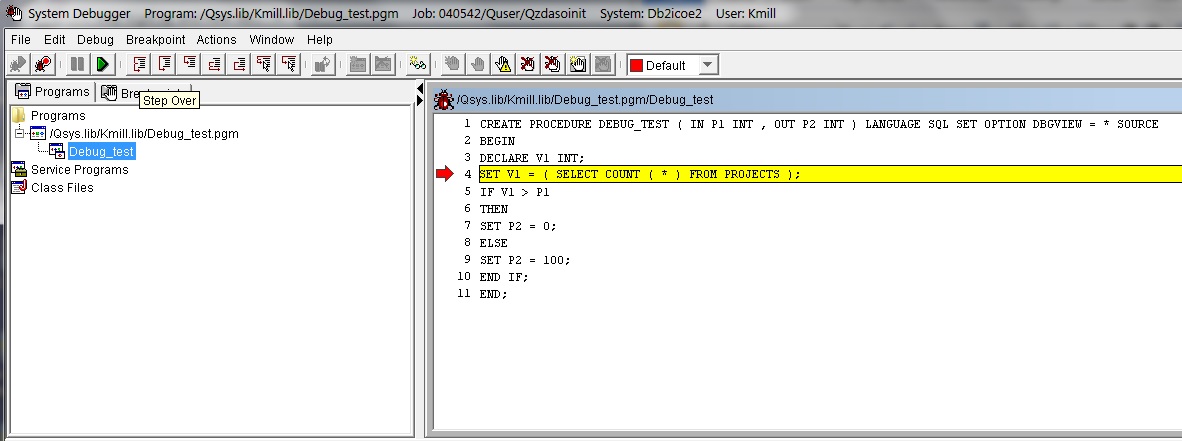
Let's assume that you've set and hit a breakpoint on the first SET statement using the IBM i graphical debugger as shown in Figure 1. Prior to the recent enhancements, a developer would have had to hit the Step Over menu bar task 11 times to execute the SET statement and advance to the next SQL statement. The green-screen debugger, STRDBG, had the same issue when using the Step command or F10 key.
Obviously, this strange Step behavior frustrated and confused many IBM i developers. That inefficiency and confusion all goes away with the latest enhancements; a single Step request will now advance the debug session from the SET statement to the IF statement!

Figure 1: You've set and hit a breakpoint.
The other issue arose when trying to determine the current value of a variable in a procedure. A developer could not simply type EVAL V1 to examine the current value of this local variable. Instead, the variable name had to be qualified by a label. That limitation was an even bigger headache with this example routine because a user-defined label wasn't specified on the BEGIN clause. A developer would first have to dig through the generated C code to find the system-generated label before executing the EVAL command. For this example, the generated label is SQLP_L2, so determining the current value of V1 required this "simple" command:
EVAL SQLP_L2.V1
Clearly, the old EVAL support was cumbersome. With the recent enhancements, a developer just needs to enter EVAL %%V1. This improvement eliminates the need for a developer to create, find, or enter a label-name! (If you're already in the practice of adding labels and using those labels in the EVAL command, that approach will still work.)
Accessing these enhancements for the green-screen debugger is as simple as loading the Database Group PTF level 32 for the 7.1 release and level 3 for the 7.2 release. These enhancements for the graphical debugger are being delivered with the next IBM i Access for Windows service pack, which is scheduled to be available in December 2014.
If you weren't aware of the no-charge IBM i graphical debugger available for debugging SQL routines (and IBM i programs), check out this white paper for more information.
So get your systems current and enjoy debugging your SQL routines without the headaches!


 Business users want new applications now. Market and regulatory pressures require faster application updates and delivery into production. Your IBM i developers may be approaching retirement, and you see no sure way to fill their positions with experienced developers. In addition, you may be caught between maintaining your existing applications and the uncertainty of moving to something new.
 IT managers hoping to find new IBM i talent are discovering that the pool of experienced RPG programmers and operators or administrators with intimate knowledge of the operating system and the applications that run on it is small. This begs the question: How will you manage the platform that supports such a big part of your business? This guide offers strategies and software suggestions to help you plan IT staffing and resources and smooth the transition after your AS/400 talent retires. Read on to learn:
LATEST COMMENTS
MC Press Online