We started through Zend Studio debugging a month or so ago. Now it’s time to pick up that thread and continue.
You haven’t worked on this (using Zend Studio to debug your scripts) at all in the last two months, have you?
No. Don’t try to explain. I’ve heard it all by now: “I was busy.” “I was tired.” “My dog ate my homework.” Yeah, whatever. Let’s just get going.
Types of Errors
Every program has potentially two types of errors.
The first is syntax—that is, mistakes in spelling, punctuation, or format that make the code line inoperable. In RPG, that would be writing REED instead of READ. In PHP, it could be forgetting one of those stinkin’ curly braces.
The second are what I will call logic errors, mistakes in the way you have structured your program so that what you are expecting to happen doesn’t. This would include things like improperly structured IF statements, complex calculations that are syntactically OK but calculate the wrong result, that sort of thing.
Two months ago, we introduced a syntax error into our script. Specifically, we screwed around with the quote marks, so we had an unbalanced quote. And we saw what happened; the IDE, Zend Studio, saw the imbalance and flagged that line with a red X. It also gave us some fairly unhelpful error messages, but the result is that you can see something was wrong.
Logic errors, of course, are something the IDE can’t recognize and highlight, although that would be one heck of a marketing point. So, it is really with logic errors that debugging comes into play; you see that your script is not functioning like it should, so you run debug to step down through it and see where the problem is.
PHP Script
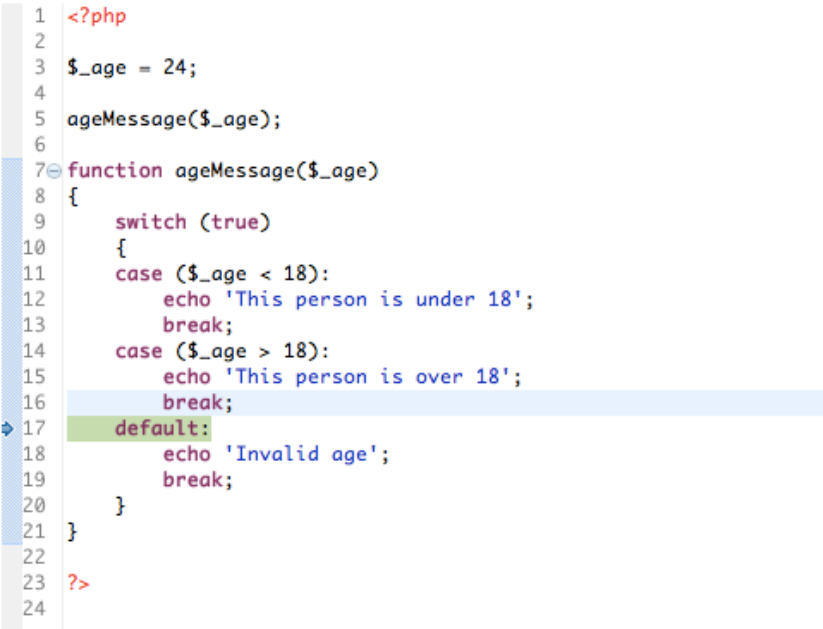
To illustrate this point and get us started with the debugger, we will start with the following PHP script.

Figure 1: Use this PHP script.
Go ahead. Don’t be afraid of it. Key it into a PHP file in your copy of Studio and save it. And no, I don’t give a hoot what you call it. Keep it clean, though.
This is a pretty simple script. It starts on line 3 by creating global variable $_age and setting its value to 24.
What we’re trying to simulate here is the call of this code from somewhere else where a parm is passed in. Maybe the value of the parm will come from a web form. I honestly don’t care. I just wanted to come up with a simple script that had an input parm, and this is the best I could do. Thinking of examples is not a top-ten skill for me. Bottom line, I am setting the value of the parm that’s passed into the function ageMessage at the start of the script.
Then on line 5 we “call,” or invoke, the ageMessage function, passing in the $_age variable.
Below this, starting on line 7, is the definition for the ageMessage function, and we see that, when this is accessed, we’ll check the value of the variable $_age. If it’s less than 18, we display the message ‘This person is under 18’, and if the value is more than 18, we show ‘This person is over 18’. I’m guessing you can see where I’m going with this, but judge me gently; I’m just trying to keep this simple from a code perspective.
Running the PHP Script
OK, the next step is to run the PHP script that we have set up. No need to do debug yet—who knows; it might actually work.
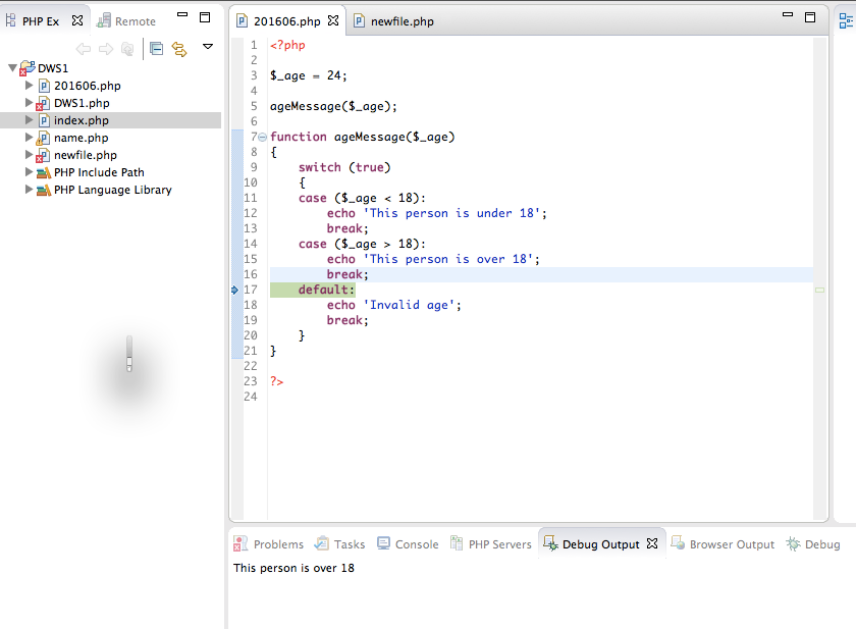
So, with the file still open (or not; it doesn’t matter), go up to the top menu line, slide over to Run, click on Run As, and click on PHP CLI Application. If everything goes well, and it probably won’t but let’s hope, then you’ll get something similar to the screen below, where right at the bottom of the screen is the message ‘This person is over 18’, just as we would expect.

Figure 2: These are the results of the run with $_age = 24.
Introducing a Logic Error
OK, now go back to this script and change the age from 24 to 18. Save it and then run again. This time, you should get the same screen as above, except that the error will say ‘Invalid age’.
Since we never want to get an ‘invalid age’, we know there’s a problem. The question is, what’s wrong? It’s pretty obvious to us what the problem is, but if you were using this routine and feeding it a value from a form, then you would not have line 3 and you would have no idea what the value of the age was. Consequently, you would have no idea why you were getting an invalid age. So let’s play this out and get a debug going.
Debugging the Script
We will use Zend Debug for this, the default debugger in Studio.
Just as a heads up, before you start debug, check out the Run > Terminate option and make sure it’s greyed out (that is, the script is not still running). If it’s not greyed out, click on it to stop this script. I have had some issues with this, so I always check it.
Once you’re sure the previous app run is done, to debug, go back to Run and click on Run > Debug As > PHP CLI Application.
You’ll probably get a window called Confirm Perspective Switch that starts with “This kind of launch is associated with the Debug perspective, yada, yada, yada.” What it wants to do here is take you out of the edit-oriented PHP window set and put you in the Debug window set. Just say Yes.
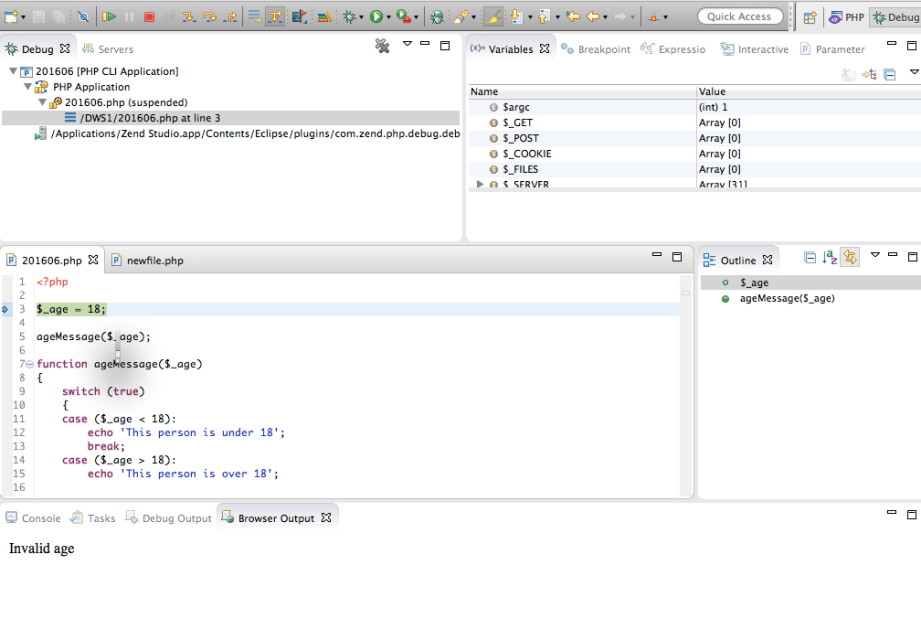
There may be a slight grinding noise while the Studio gears begin to shift, but in a minute you’ll see the screen below.

Figure 3: We’re in the initial debug screen.
We’re going to focus on the window that has the code displayed in it. Notice that line 3 is sort of green. This indicates that this is where the script starts and is where control is located.
The second thing I want you to notice is the very top line of icons on the screen. If you scroll along these from left to right, you will see a yellow arrow (actually three of them, but I’m talking about the leftmost one now) after the red square (Terminate). If you place your cursor over this (the first yellow arrow), you see it is the Step Into option, and this is what we will use to step down through the script.
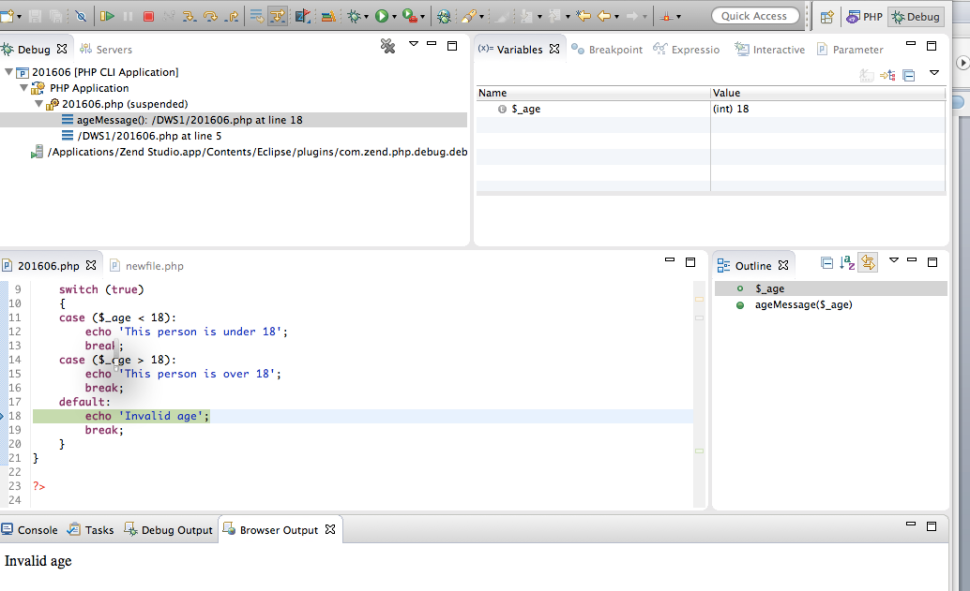
If you click on Step Into once (or maybe twice the first time), it moves the highlight down to line 5, which is where we invoke the function. You may also notice, if you look at the window on the upper right corner, that whereas a minute ago $_age did not show up in this window, now it is listed (now that the line to define it has been executed) and it’s value is 18. If this were a purely parameter-driven process where we didn’t know what value was being assigned to $_age, then this is how we could find out. The nice thing here is that you can always see the values of all your variables. You don’t have to pick one and just look at that one.
If we continue to click on the Step Into, we will see that we move down into the function definition and through the switch statement. Even if we didn’t realize immediately that 18 was a blind spot value for this, it would become obvious as we roll down thru the case options and trigger none of them until we get to “default.” which is what happens when nothing else is triggered.

Figure 4: This is what the Debug screen looks like after stepping through it.
So this is how Debug lets you move through the script, and also, using the upper right corner window, you can see the values for your various variables. Just as a note, the other things that are listed there are PHP global variables that are always available and that you may or may not be using. We aren’t, but that’s not your fault.
More Basic Debug Functions
Of course, Debug does more than just step down through a script.
You can also Step Over to skip a line of code. Used repeatedly, you could just zip down through a script…as long as you don’t skip over the line you want to see. I would do that. Skip over the line I need, that is. And I would not do it just once but multiple times. And that’s why I rarely use this function. But, for the more coordinated, it’s there.
You can also set breakpoints. To do so, you just position yourself on the line where you want the breakpoint and either double-click on the blue border to the left of the line or go up to Run > Toggle Breakpoints and click on that (when the cursor is on the line you want for the breakpoint). To undo a breakpoint, you can either use Run > Toggle Breakpoints again or once more double-click in the blue margin.
To run from one breakpoint to another, use the Resume icon in the icon line. This a pointed kind of thing like a square and a triangle lying on its side (in version 13, it’s two icons to the left of the red Terminate icon).
You also have the option for Step Filtering, and there’s an icon on the icon line to activate that. The idea of the step filtering is that you can identify things—maybe files, for example—that you want to skip over when you’re debugging so that even if you’re using Step Into, it will bypass the things listed in the Step Filtering table. More info on how to use this can be found here.
Everything we did today was in terms of a PHP command-level interface (CLI) application, one that we run within our machine. But Debug can also be used to debug existing web applications when they are remotely installed on the web. I think that’s pretty neat. You have to enter the URL that you want to debug, but it’s cool you can do that.
That’s All Folks
And that’s it. Just a quick look at Studio Debugger. It’s easy when you come from the RPG world to think that PHP is all magical and there’s no way you will ever understand what’s going on. And that’s pretty much true. But knowing how to use debugger is the best shot you have at figuring out what’s going on. Get familiar with it.
What will we do next month? Seriously. I am concerned about the fact that you think I have thought this through. That’s for guys like Rafael Victoria-Pereira. Apparently, he submits his articles a year in advance. I am about three weeks out. So I will be as surprised as you by what comes next. But please stay tuned. I’ll figure somethin’ out.


 Business users want new applications now. Market and regulatory pressures require faster application updates and delivery into production. Your IBM i developers may be approaching retirement, and you see no sure way to fill their positions with experienced developers. In addition, you may be caught between maintaining your existing applications and the uncertainty of moving to something new.
 IT managers hoping to find new IBM i talent are discovering that the pool of experienced RPG programmers and operators or administrators with intimate knowledge of the operating system and the applications that run on it is small. This begs the question: How will you manage the platform that supports such a big part of your business? This guide offers strategies and software suggestions to help you plan IT staffing and resources and smooth the transition after your AS/400 talent retires. Read on to learn:
LATEST COMMENTS
MC Press Online