


Some charts are easier to understand if the original data is also available. Learn how to place a chart and a data table side by side and then link them so the user can interact with both.
Usually a well-chosen and properly formatted chart is all it takes to get your message across, but there are times when you also want to include the original data. You'd do this to provide the level of detail that some charts lack (see the Intensity Map, for instance). This can be achieved by using two APIs simultaneously; you'll need to add the Table API to whichever chart you want to show. In this TechTip, I'll use the Combo API side by side with it to achieve this:
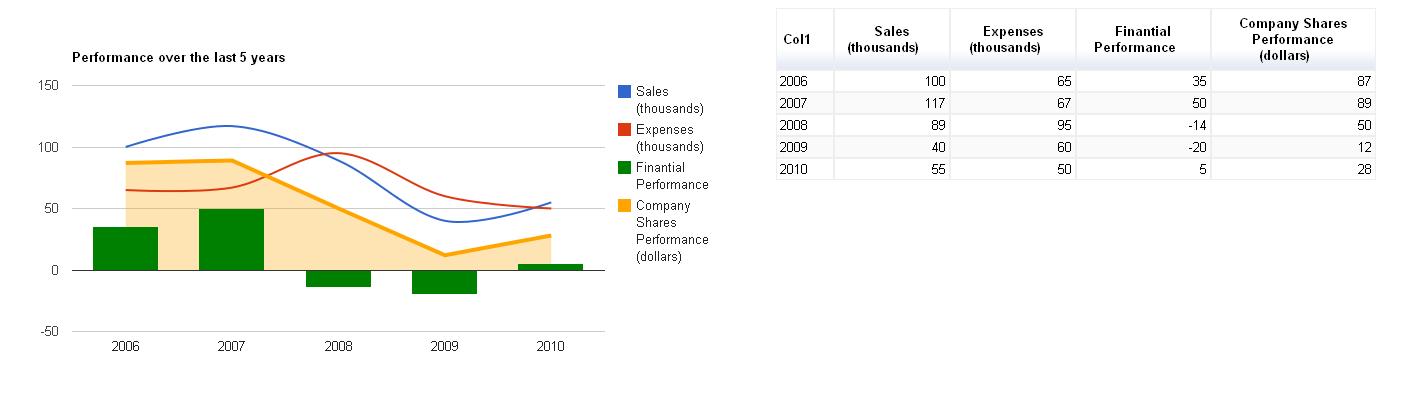
Figure 1: The chart and table combination is produced by the TSTGENCPT2 sample program.
I'll also explain step by step how you can customize the existing templates and procedures from previous TechTips to achieve the same effect.
As usual, let's start with the template (see file ComboTbl.tmpl in folder \GCHARTS\TEMPLATES of the downloadable source code at the end of this TechTip):
/$Header1
<!DOCTYPE html PUBLIC "-//W3C//DTD XHTML 1.0 Strict//EN" "http://www.w3.org/TR/xhtml1/DTD/xhtml1-strict.dtd">
<html xmlns="http://www.w3.org/1999/xhtml">
<head>
<meta http-equiv="content-type" content="text/html; charset=utf-8"/>
<title>
/%PageTitle%/
</title>
<script type="text/javascript" src="http://www.google.com/jsapi"></script>
<script type="text/javascript">
google.load('visualization', '1', {packages: ['corechart']});
</script>
/$TableHeader
<script type="text/javascript">
google.load('visualization', '1', {packages: ['table']});
</script>
/$Header2
<script type="text/javascript">
function drawVisualization() {
// Create and populate the data table.
var data = new google.visualization.DataTable();
data.addRows(/%TotalRows%/);
data.addColumn('string', 'Col1');
/$Column
data.addColumn('number', '/%ColumnTitle%/');
/$FirstRow
data.setValue(/%RowNbr%/, 0, '/%RowTitle%/');
/$Row
data.setValue(/%RowNbr%/, /%ColNbr%/, /%CellValue%/);
/$OptionsBegin
var options = {
/$Option
'/%OptionTitle%/': /%OptionLongValue%/
/$OptionsEnd
};
/$ChartDraw
// Create and draw the visualization.
var chart = new google.visualization.ComboChart(document.getElementById('chart_div'));
chart.draw(data, options);
/$TableDraw
// Then the Table
var table = new google.visualization.Table(document.getElementById('table_div'));
table.draw(data, null);
// Link the chart and table together to allow interaction
google.visualization.events.addListener(chart, 'select',
function() { table.setSelection(chart.getSelection()); });
google.visualization.events.addListener(table, 'select',
function() { chart.setSelection(table.getSelection()); });
/$Footer1
}
google.setOnLoadCallback(drawVisualization);
</script>
</head>
<body style="font-family: Arial;border: 0 none;">
<table>
<tr valign="top">
<td><div id="chart_div" style="width:/%ChartWidth%/px"></div></td>
/$TableFooter
<td width="30"></td>
<td><div id="table_div" style="width:/%TableWidth%/px"></div></td>
/$Footer2
</tr>
</table>
</body>
</html>
I used the Combo.tmpl template as a starting point and changed it a bit to include the call to the Table API. I wanted this new template to replace the old one, even if you don't want to show a table; to make that possible, all the table-related code was segregated into separate sections. Let's go over them one by one.
The Header section was split in two to accommodate a new section named TableHeader. This new section is used to load the table package; think of it as a prototype declaration in RPG. Everything between the sections Column and OptionsEnd remained untouched. The Footer section, however, had to the totally redesigned. To tell you why, I have to explain how the link between the chart API and the HTML page works: the chart needs to be shown somewhere, right? Well, Google indicates that a <div> HTML section should support the display of the API invocation result. In this case, I have two APIs (a chart and a table), which means that I need two <div> sections; because I want to show the chart and table side by side, I need to control the formatting of the HTML. The best way to do this is by using an HTML <table> section. In my template this translates into the ChartDraw, Footer1, TableFooter and Footer2 templates. ChartDraw invokes the Chart API (the ComboChart in this case) and links it to the 'chart_div' <div> HTML section; Footer1 tells the browser to call the drawVisualization function (this function holds all the JavaScript code required to draw the charts) and builds the first part of the <table> HTML section. Then the TableFooter section handles the <div> HTML section that's used by the Table API.
I've skipped over the TableDraw section on purpose. This section creates the table and indicates that the 'table_div' <div> HTML section will support the table display and, more importantly, creates a link between the table and the chart. This link is achieved with these lines of code:
google.visualization.events.addListener(chart, 'select',
function() { table.setSelection(chart.getSelection()); });
google.visualization.events.addListener(table, 'select',
function() { chart.setSelection(table.getSelection()); });
Basically, I'm telling the browser to "listen" to a click on a point of the chart and, when that happens, to act as if the corresponding row of data on the table had been clicked and vice versa. This is not very easy to explain, so run the same programs and try it yourself.
Finally, the Footer2 section simply closes the open HTML tags.
Naturally, a new template requires a new procedure. I've created GenComboTblChart based on GenComboChart and added a few new entry parameters to allow you to decide whether the table should be displayed or not (P_ShowTable parameter) and to choose the width of the chart and the table (P_ChartWidth and P_TableWidth parameters). The Proc routine handles the writing of the Tablexxx sections according to the value of the P_ShowTable parameter; if it contains a 'Y' then the sections will be written in the output html file.
New sample programs were created. They were also based on the sample programs of the Combo Chart TechTip. The only differences are the name of the procedure that is called and the three new parameters. Just a note of caution: don't use the 'width' keyword on the options parameter (P_OptionDS) or, if you do, be sure to use the same value on P_ChartWidth. It's a bit hard to explain the possible effects. Just change the TSTGENCPT1 or TSTGENCPT2 sample programs and see for yourself.
I hope that after reading this TechTip you have all the necessary information to change the other procedures the same way I've changed the Combo Chart procedure.
You can download the complete source code here. Feel free to contact me with any questions or suggestions you may have!

Rafael Victória-Pereira has more than 20 years of IBM i experience as a programmer, analyst, and manager. Over that period, he has been an active voice in the IBM i community, encouraging and helping programmers transition to ILE and free-format RPG. Rafael has written more than 100 technical articles about topics ranging from interfaces (the topic for his first book, Flexible Input, Dazzling Output with IBM i) to modern RPG and SQL in his popular RPG Academy and SQL 101 series on mcpressonline.com and in his books Evolve Your RPG Coding and SQL for IBM i: A Database Modernization Guide. Rafael writes in an easy-to-read, practical style that is highly popular with his audience of IBM technology professionals.
Rafael is the Deputy IT Director - Infrastructures and Services at the Luis Simões Group in Portugal. His areas of expertise include programming in the IBM i native languages (RPG, CL, and DB2 SQL) and in "modern" programming languages, such as Java, C#, and Python, as well as project management and consultancy.
MC Press books written by Rafael Victória-Pereira available now on the MC Press Bookstore.
 |
Evolve Your RPG Coding: Move from OPM to ILE...and Beyond Transition to modern RPG programming with this step-by-step guide through ILE and free-format RPG, SQL, and modernization techniques. List Price $79.95 Now On Sale
|
|
 |
Flexible Input, Dazzling Output with IBM i Uncover easier, more flexible ways to get data into your system, plus some methods for exporting and presenting the vital business data it contains. Now On Sale
|
|
 |
SQL for IBM i: A Database Modernization Guide Learn how to use SQL’s capabilities to modernize and enhance your IBM i database. Now On Sale
|

 Business users want new applications now. Market and regulatory pressures require faster application updates and delivery into production. Your IBM i developers may be approaching retirement, and you see no sure way to fill their positions with experienced developers. In addition, you may be caught between maintaining your existing applications and the uncertainty of moving to something new.
 IT managers hoping to find new IBM i talent are discovering that the pool of experienced RPG programmers and operators or administrators with intimate knowledge of the operating system and the applications that run on it is small. This begs the question: How will you manage the platform that supports such a big part of your business? This guide offers strategies and software suggestions to help you plan IT staffing and resources and smooth the transition after your AS/400 talent retires. Read on to learn:
LATEST COMMENTS
MC Press Online