Your AS/400 has just had a major failure, and you have received a message that a main storage dump has occurred. Your IBM service rep wants to see a copy of the dump. What do you do? One of your communication lines doesn’t seem to be performing at top capacity, but the modem seems to pass all the self-test routines. What do you do? Your hardware upgrade plan requires a printout of your current hardware resources. What do you do? System service tools just might provide the answers that you need.
A Brief Overview
The system service tool (SST) function found on the AS/400 provides a group of tools to help manage problem reporting and analysis, disk configuration, and hardware management. These tools become useful in providing the means to assemble data on hardware that may be malfunctioning or providing disk- and hardware-configuration information prior to a CISC to RISC migration or other hardware upgrade. They also provide a means for reviewing some of the problem data for specific hardware resources. The hardware service manager is also one of the tools that can be used not only to view resource information but also to modify some of the information associated with a specific resource. Consequently, the system service tools come with a warning that only experienced personnel should use them. If used improperly, they may cause certain hardware resources to function improperly. For example, if a resource label is modified, any line or controller descriptions that might reference the old label will no longer function.
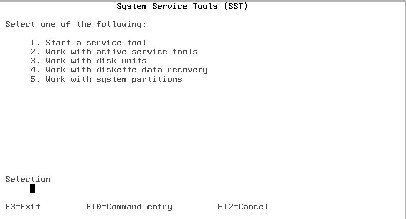
It is simple enough to start system service tools, but, because of the sensitive nature of some of the tools, you may find that the commands are secured at your particular shop. You will need either *ALLOBJ authority or specific authority to execute the SST command. Also, some of the functions available to you with SST require you to have *IOSYSCFG authority on your user profile. To begin using the system service tools, enter the command Start System Service Tools (STRSST) on a command line. You will be presented with a menu that will provide a varying number of options depending on your operating system version and release. As Figure 1 shows, you can start a service tool, work with an active service tool (such as an active communications trace), work with disk units, or work with diskette data recovery. On newer releases of OS/400 that support logical partitioning, you may also see the option to work with logical partitions.
A More Detailed Look
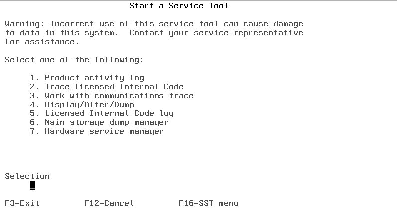
Figure 2 shows the service tools available. They are as follows:
• Product activity log allows the user to display or print errors that have occurred in disk units, controllers, or communications devices including LAN cards.
• Trace Licensed Internal Code lets you start or stop a trace of the Licensed Internal Code (LIC). This tool also lets you display, dump, or clear the tables where this data is recorded.
• Work with communications trace allows you to stop or start a trace of data on a network line or a communications line. This tool provides the same functions as the CL commands Start Communications Trace (STRCMNTRC) and End Communications Trace (ENDCMNTRC). It also allows the data recorded from a trace to be formatted and printed. This printed data is then usually sent out to a third party for review and analysis.
• Display/Alter/Dump lets you display or change virtual storage. IBM recommends using this option only when directed by your service representative.
• Licensed Internal Code log allows you to display Licensed Internal Code log information.
• Main storage dump manager allows you to print the contents of a main storage dump or dump the information to tape or diskette. In those cases in which a severe software or hardware problem has occurred, you may be presented with a message that a main storage dump has occurred. This tool would be used to print out the dump information that the IBM service representative might require for review.
• Hardware service manager allows you to display, work with, and print the stored hardware resource information. Both logical and packaging hardware resources can be displayed. This option also allows you to display, alter, trace, or dump the I/O processor Licensed Internal Code. These processors control storage devices, workstations, and communication data links.
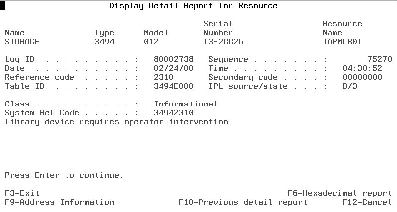
The most commonly used tool is the product activity log. Sometimes, performance problems relating to communications or networking can be traced to errors that are only logged in the product activity log. As Figure 3 shows, it also provides detailed information on hardware resources that may be malfunctioning. You can review all logs or review logs by category. The logs are divided into groups by processor, magnetic media, local workstation, communications, power, licensed program, or Licensed Internal Code. The available information includes system reference code, date and time that the entry was logged, the error class, resource name, resource type, card and device position, device name, and description. Many times, your service representative may ask for the system reference code because it shows the hardware error code for the failing condition. This tool also provides the capability to change the log size. An option to display system reference code descriptions is also available.
Another common system service tool is the hardware service manager. On the PowerPC machines, which encompass those models that have RISC-based processors, this tool replaces some of the functionality of the Work with Hardware Products (WRKHDWPRD) and the Edit Device Resource (EDTDEVRSC) commands. For some upgrade processes, such as a CISC-to-RISC upgrade, it is necessary to print the hardware configuration to track the resource labels during the process. This tool provides the capability to print the system configuration prior to the upgrade and allows you to correct resource labels where necessary once the upgrade is finished. Serial number information can also be displayed or updated. You may also locate resources by resource name, display
failed and nonreporting resources, work with the service action log, and display the label location worksheet.
The work with communications trace tool may be required to review communication processes in detail when basic analysis does not reveal what may be causing performance problems. It is recommended that the trace be started prior to even varying on the communications device that is experiencing the problem. The trace provides detailed information about everything that occurs during a communication session. This allows detailed analysis to determine whether line noise may even be the cause of performance degradation. Once the trace has been completed, it has to be formatted and then printed.
The remaining tools at this level, including the LIC trace, main storage dump manager, and Display/Alter/Dump, are generally used only under the direction of your service representative because they are usually indicative of very severe problems.
Other Options
The main system service tools menu also provides a couple of other options that are useful. Work with disk units provides such options as Display and Work with disk configuration. This information includes the disk status, capacity, protection, nonconfigured units, device parity status, and disk failure status. This can tell you whether a device that is under parity protection has failed or is being rebuilt.
The Work with disk configuration option also provides the capability to modify the disk storage threshold for an auxiliary storage pool (ASP). The system default level for a storage pool is normally 90 percent. Once disk storage reaches the threshold level, a message starts appearing on the QSYSOPR message queue that the ASP threshold has been exceeded. While it is not normally advocated that you increase the percentage, it can be done to eliminate the message from constantly appearing. Remember that the system needs a certain amount of disk storage to even IPL, so a low-disk-storage situation can be serious and should be addressed as soon as possible.
New versions of the operating system can bring additions to the service tools. One of the new features of the operating system in V4R4 allows logical partitions to be created. A new option on the main menu of the system service tools allows you to print the logical partition information.
Final Thoughts
While the system service tools can provide you with a wealth of analysis data, I must again emphasize that, if used in the wrong hands by inexperienced personnel, they can also cause a great deal of damage. Use them, but use them wisely!
References and Related Materials
OS/400 Backup and Recovery V4R4 (SC41-5304-03, CD-ROM QB3ALE03)

Figure 1: A number of options are available when you start system service tools.

Figure 2: These are the system service tools available.

Figure 3: The product activity log provides detailed information on hardware resources that may be malfunctioning.


 Business users want new applications now. Market and regulatory pressures require faster application updates and delivery into production. Your IBM i developers may be approaching retirement, and you see no sure way to fill their positions with experienced developers. In addition, you may be caught between maintaining your existing applications and the uncertainty of moving to something new.
 IT managers hoping to find new IBM i talent are discovering that the pool of experienced RPG programmers and operators or administrators with intimate knowledge of the operating system and the applications that run on it is small. This begs the question: How will you manage the platform that supports such a big part of your business? This guide offers strategies and software suggestions to help you plan IT staffing and resources and smooth the transition after your AS/400 talent retires. Read on to learn:
LATEST COMMENTS
MC Press Online