Cilasoft offers its new Job Log Explorer tool to the IBM i community at no cost.
Anyone who has searched through mountains of pages in job logs to find specific program messages during the process of troubleshooting knows all too well how time-consuming and tedious this task can be. In fact, as my team and I have worked with customers and partners over the years, we’ve commonly heard complaints about this very thing. But what’s surprising is there hasn’t been a useful tool available (at least that we could find) to help quickly isolate critical job information in these ungainly job logs. It’s basically a process of repeatedly pressing the F16 (Shift+F4) search key while trying various search terms.
One day, while working with a customer who was burdened by the mind-numbing tediousness of combing through a particularly large job log, one of our technicians decided to do something about it. He came back to the office and created a flexible, simple-to-use tool for searching job logs. The rest of us began to use and refine it, and it definitely made our lives easier, so we decided we should give it a nice interface and share it with customers and partners. And then we thought, “Let’s go a step further and share this tool with the entire IBM i community and do so for no charge to make life a little easier for everyone.” In August of this year, we introduced the Cilasoft Job Log Explorer and it is available here as a free download. All we ask in return is you give us basic contact information when you download the tool and then re-register the license annually at no cost.
By making this tool available to everyone for free, we admit it helps with the publicity of Cilasoft and its security and compliance offerings; however, our intention wasn’t to create some kind of free software that identifies issues in your environment that can only be resolved with paid software (as is often the case when free software is being offered by vendors). Once we created this simple tool and found how useful it is, our primary motivation was to share it broadly with the IBM i community and lessen one of our common headaches.
Key Features of Job Log Explorer
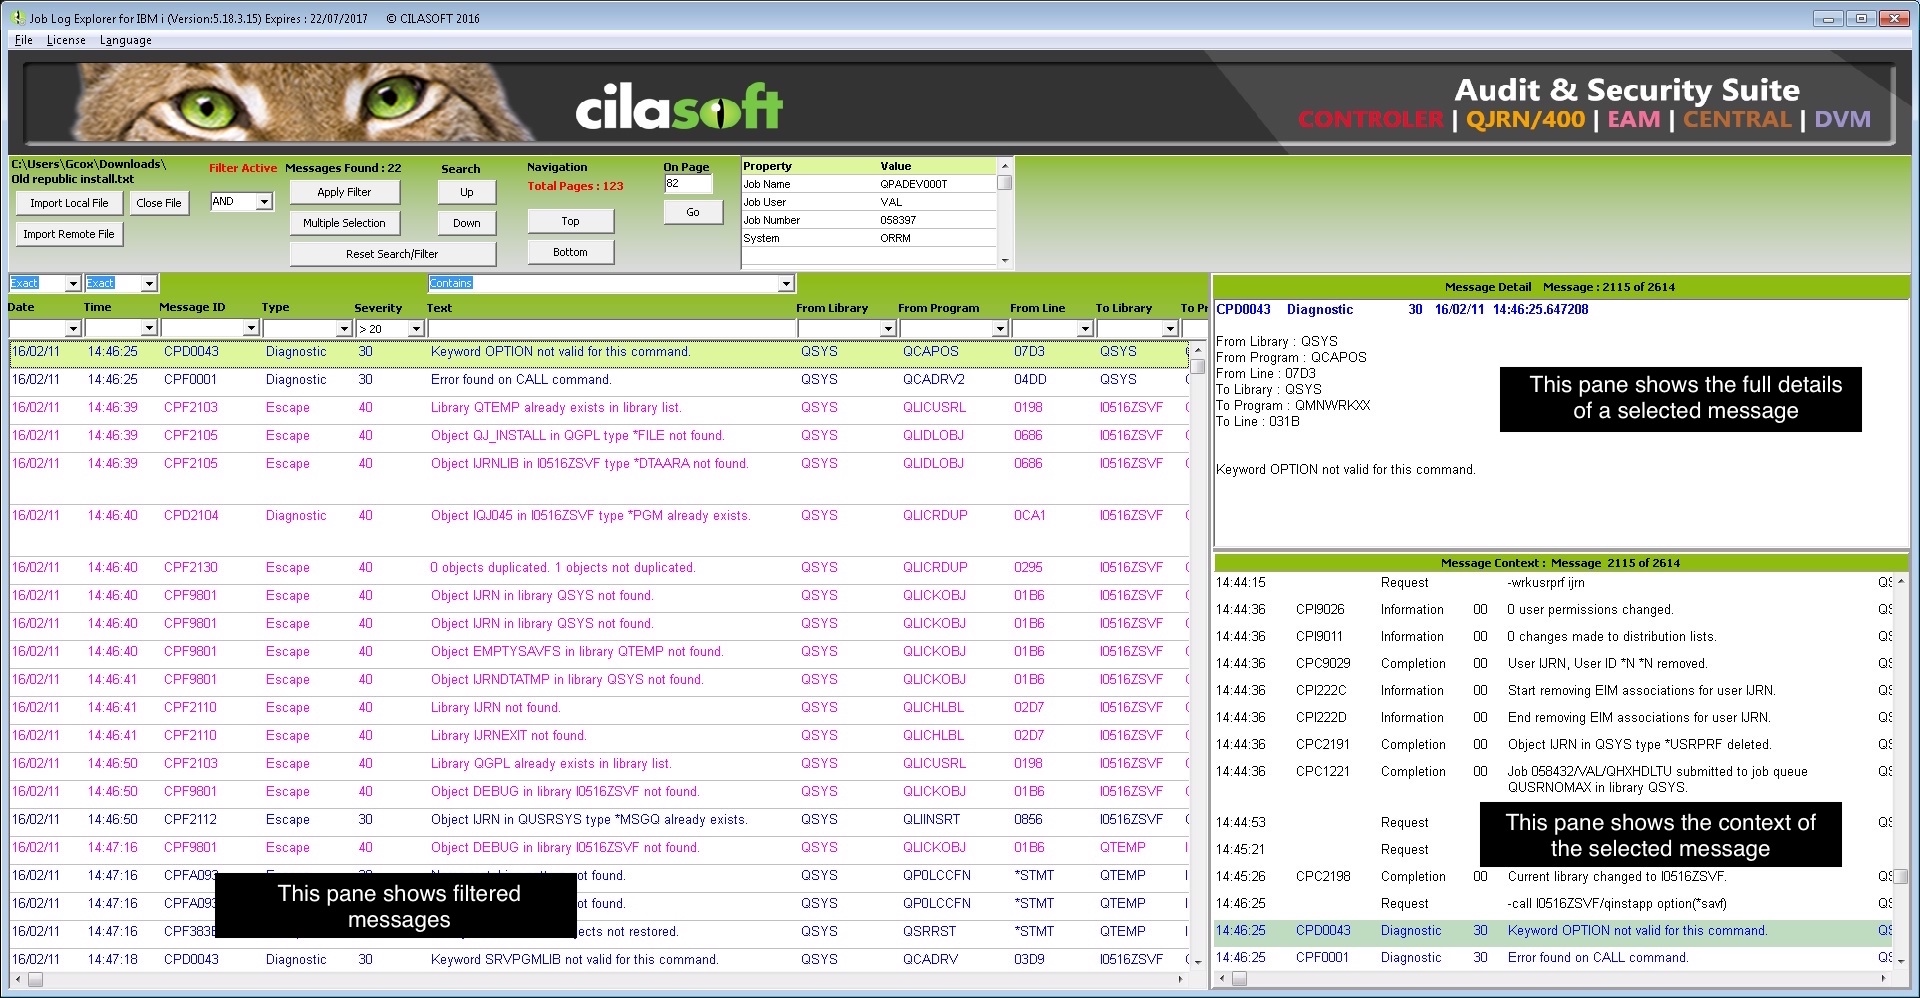
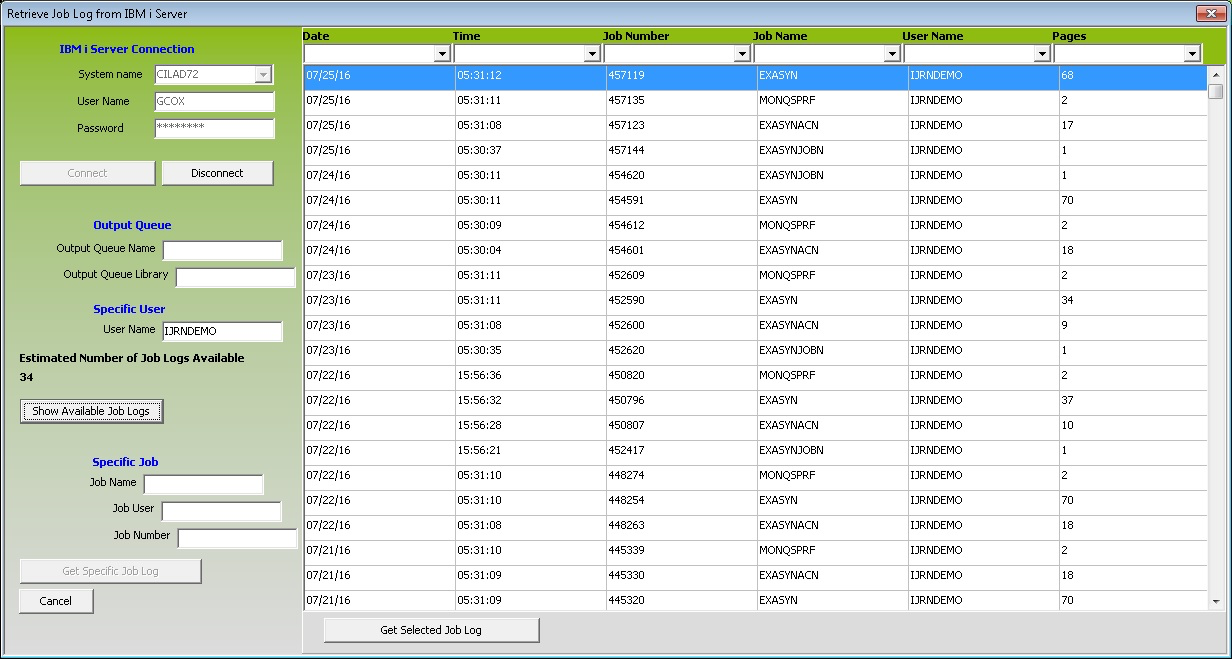
- View any job log directly from within its output queue on any connected system. Users can view job logs for a specific user or work with job logs as locally saved text files.
- Sort job entries by severity, text, message ID, etc. Job logs accessed by the tool are automatically parsed into columns for easy reading and click-sorting.
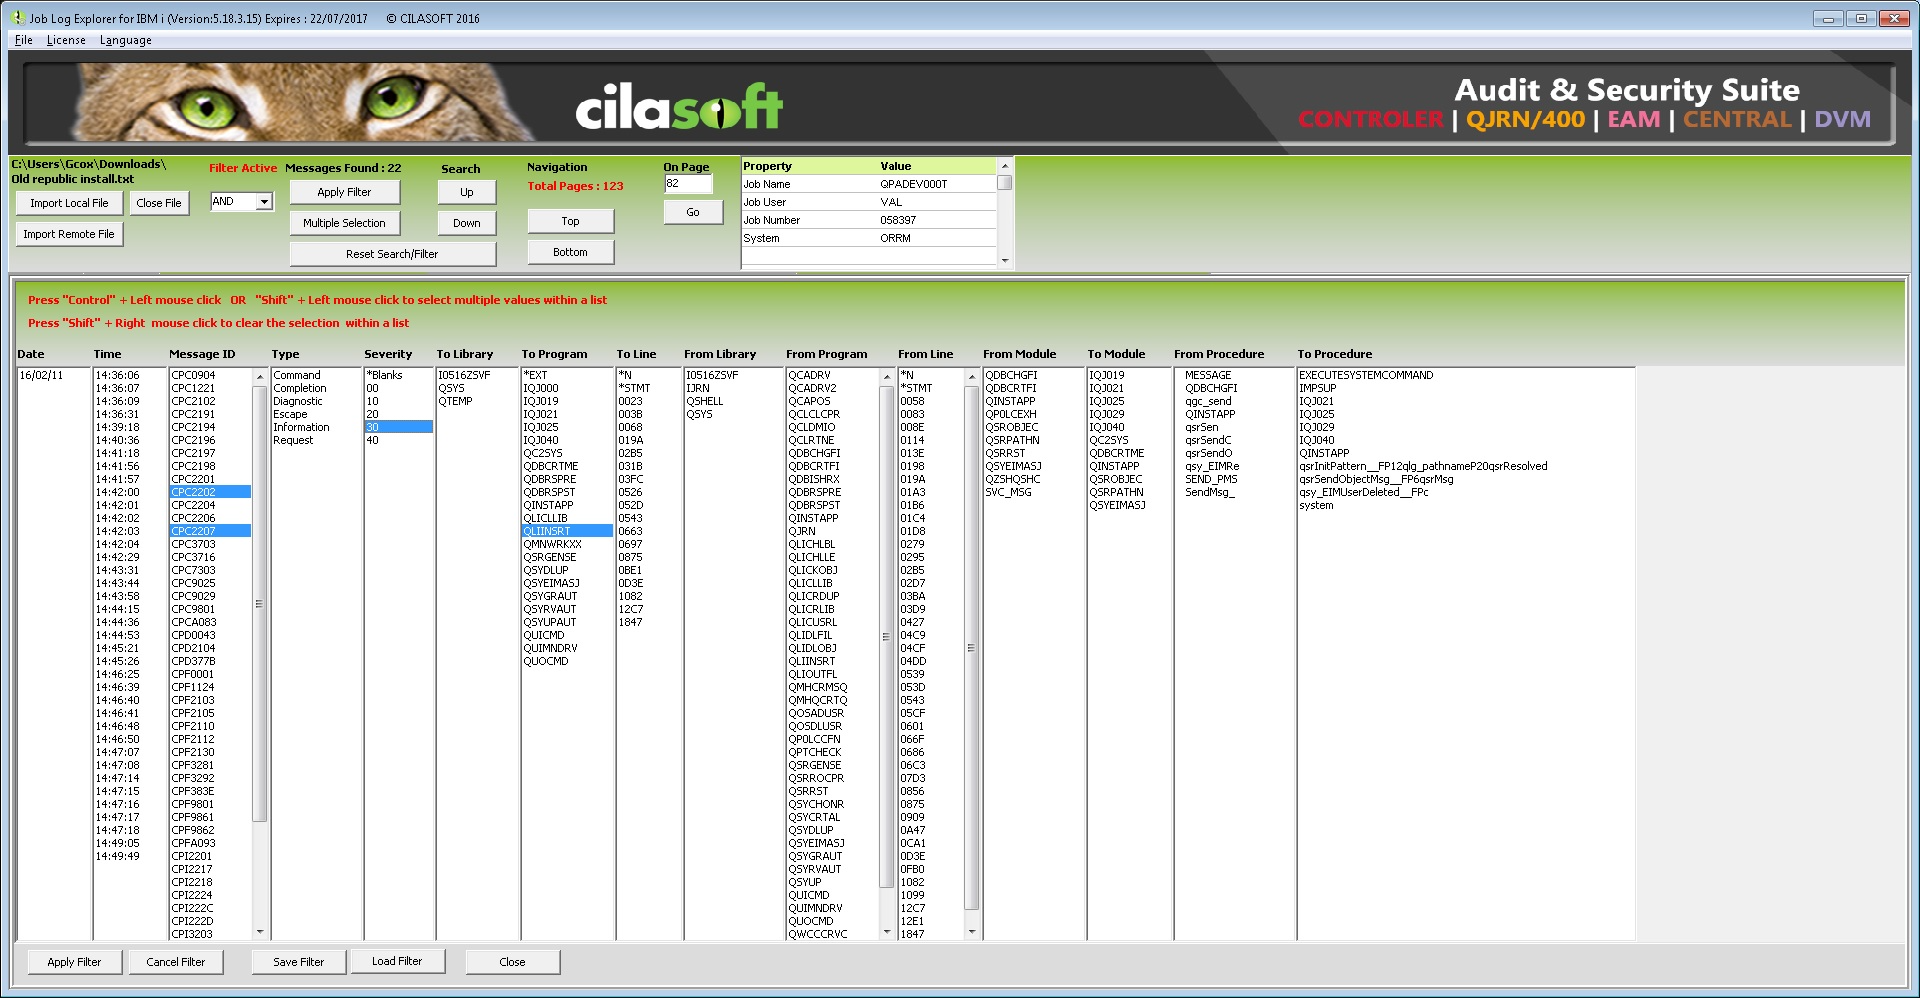
- Filter job entries by single or multiple parameters using “And” and “Or” filtering options.
- Supported languages for job logs are English, Spanish, German, Italian, French, and Portuguese. The tool interface is available in English, French, or Spanish.
- Save filtered job entries as a separate file in .xml, .csv, or .html formats.
- Advance to any specified page within a job log.
Below are a few screens to give you a better sense of the features of the tool (click on any of these to see a larger version):

Figure 1: This is the main navigation and log-viewing screen (click here).

Figure 2: The multiple-criteria filter selection window is used for saving filters and loading existing filters (click here).

Figure 3: The remote system connection window is used to find job logs on a specific output queue or get a log for a specific job (click here).
We all face enough challenges as software developers and system managers, which is why I hope Job Log Explorer will benefit you. Click here to download the tool and give it a try. I encourage you to let me know what you think of Job Log Explorer and how it could be improved. You will find my email address in my bio, below.


 IT managers hoping to find new IBM i talent are discovering that the pool of experienced RPG programmers and operators or administrators with intimate knowledge of the operating system and the applications that run on it is small. This begs the question: How will you manage the platform that supports such a big part of your business? This guide offers strategies and software suggestions to help you plan IT staffing and resources and smooth the transition after your AS/400 talent retires. Read on to learn:
 Business users want new applications now. Market and regulatory pressures require faster application updates and delivery into production. Your IBM i developers may be approaching retirement, and you see no sure way to fill their positions with experienced developers. In addition, you may be caught between maintaining your existing applications and the uncertainty of moving to something new.
LATEST COMMENTS
MC Press Online