What is the true nature of database server jobs, and how can we keep them from running wild in the system?
When an IBM i environment experiences rapid CPU consumption or other conditions that impact memory, there are some jobs that will make the list of usual suspects more often than not. While QZDASOINIT jobs almost always make the lineup, they're rarely solely to blame. More often, they're only guilty by association.
Typically, it's the poorly written SQL code running in them that causes these issues, provoking QZDASOINIT jobs to gorge themselves on as much CPU as they can until they are identified and stopped.
Database Server Jobs
QZDASOINIT is the job name for database SQL server jobs. These jobs are used to serve SQL to JDBC and ODBC client applications and normally run in subsystem QUSRWRK. Since they all share the same name, it can be difficult to determine which job or series of jobs are contributing to problems like CPU spikes on the system. Potentially, there could be hundreds of QZDASOINIT jobs that are collectively creating a significant impact on CPU rather than a lone runaway culprit.
To start addressing the issue, system administrators can run the command WRKACTJOB followed by manual batch investigation and resolution at the job level (repeating the process for each system). However, the information returned on this command still leaves important questions unanswered: Who's running these jobs? What proportion of overall CPU is being consumed?
Answering these questions requires more context and greater visibility into any issues for faster problem resolution. After all, the longer an investigation process takes, the more CPU is consumed; it's always in everyone's financial interests to resolve this type of problem quickly!
Real-Time Monitoring
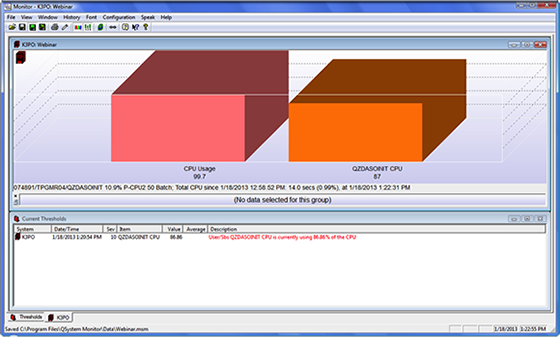
With the appropriate real-time monitoring solution in place, administrators have the ability to answer these questions. Consider the value a screen like this one from QSystem Monitor provides administrators dealing with QZDASOINIT job issues.

Figure 1: QSystem Monitor provides real-time visibility into a dedicated QZDASOINIT job's CPU and immediate access to offending jobs for resolution.
To accommodate the particulars of their environment and resources, administrators can set threshold levels for early detection, effectively forewarning them of a potentially escalating situation before it has the opportunity to take hold.
Administrators set up this type of monitor in QSystem Monitor by creating a data definition that will be qualified by any or all systems and by a particular job name. They can then choose to add custom thresholds to each monitor and issue proactive alerts when jobs exceed these thresholds.
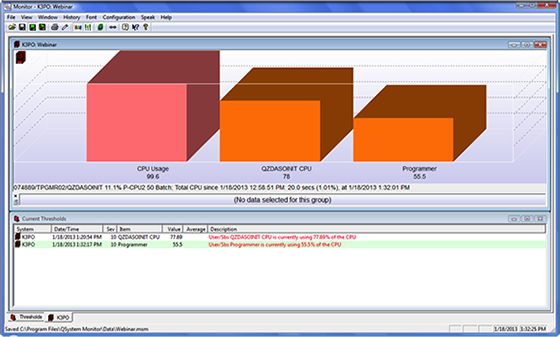
Within the data definitions, administrators can also select groups to add to these monitoring parameters. An example of this would be for a group of programmers. This degree of granular monitoring can be extended to include subsystem, accounting code, user, current user, job, and function.

Figure 2: With this monitor in place, administrators achieve proactive visibility of this group and its threshold in the context of total CPU being consumed by QZDASOINIT jobs and total system CPU consumption.
QZD and Memory
QZDASOINIT jobs can also be problematic where memory issues are concerned. In a typical example of this type of scenario, a batch job's memory is flushed by interactive jobs, leaving the batch process to perpetually try to access jobs from the memory that are no longer there. This troublesome process is known as "thrashing." Since the runaway process is most visible by its symptom of an increase in page faults, the key challenge of resolution lies in its identification.
As in the previous CPU example, the necessary investigation to determine which subsystems or jobs are being impacted by non-database page faults could be both lengthy and expensive without a real-time monitor. System administrators could first access the System Status screen to show the number of page faults in each memory pool, but they'd still be left wondering which jobs are responsible for causing problems in these memory pools and which subsystems are using them.
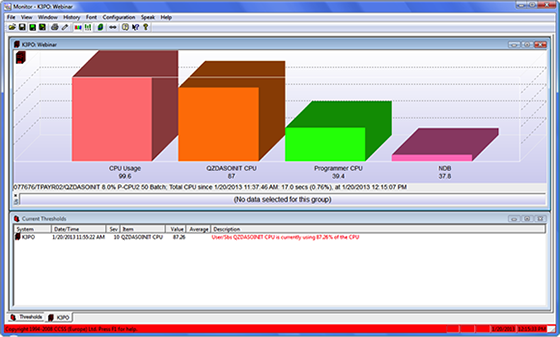
In tackling the issue, QSystem Monitor employs the same data definition qualifications to create an appropriate monitor.

Figure 3: A dedicated NDB bar shows the overall system faults per second.
This monitor has all the threshold and alert capabilities that will keep proactive system administrators one step ahead of escalating resource issues.
Tired of grappling with QZDASOINIT jobs? Try QSystem Monitor free for 30 days.


 Business users want new applications now. Market and regulatory pressures require faster application updates and delivery into production. Your IBM i developers may be approaching retirement, and you see no sure way to fill their positions with experienced developers. In addition, you may be caught between maintaining your existing applications and the uncertainty of moving to something new.
 IT managers hoping to find new IBM i talent are discovering that the pool of experienced RPG programmers and operators or administrators with intimate knowledge of the operating system and the applications that run on it is small. This begs the question: How will you manage the platform that supports such a big part of your business? This guide offers strategies and software suggestions to help you plan IT staffing and resources and smooth the transition after your AS/400 talent retires. Read on to learn:
LATEST COMMENTS
MC Press Online