Can your decision-makers get the data they need quickly and easily?
Do you store your data on different servers throughout your enterprise? Do you use different tools to extract, cleanse, and present the data? Can your decision-makers quickly get the data they need to do their jobs?
As the processes of data access, extraction, and presentation become more complex and costly, you need a solution that lets you access multiple data sources and get answers fast.
Executive Dashboards for Your Business Metrics
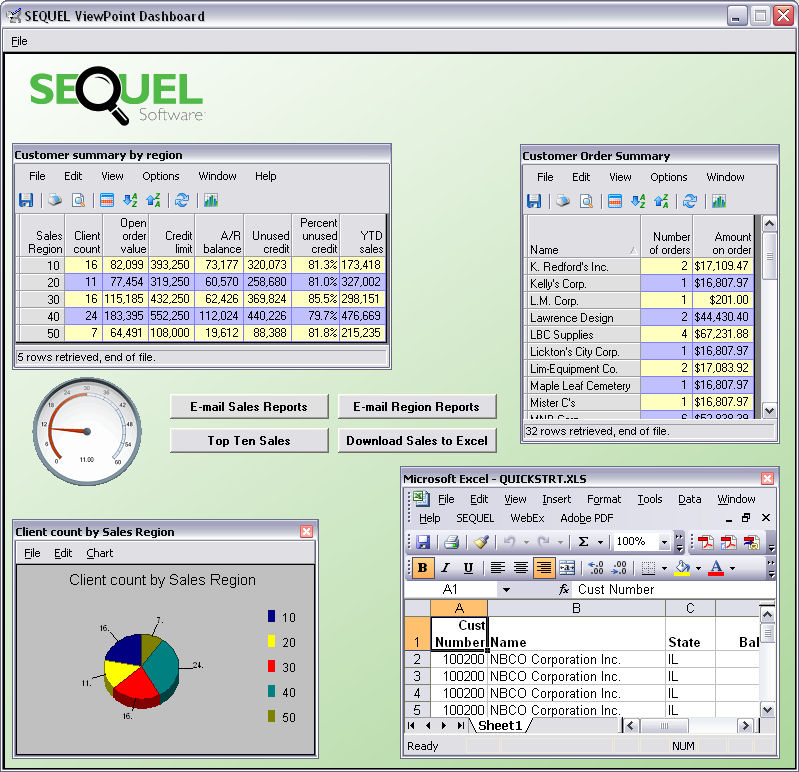
SEQUEL Executive Dashboards let you summarize and present important business measurements in a graphical window using your PC or a Web browser. They can include any combination of SEQUEL views, graphs, Web pages, images, and Windows applications—whatever you need to monitor key business activities.
Managers, executives, and other users rely on SEQUEL to deliver the metrics they need to monitor their businesses effectively, and SEQUEL Executive Dashboards provide a visual display of the information they need.
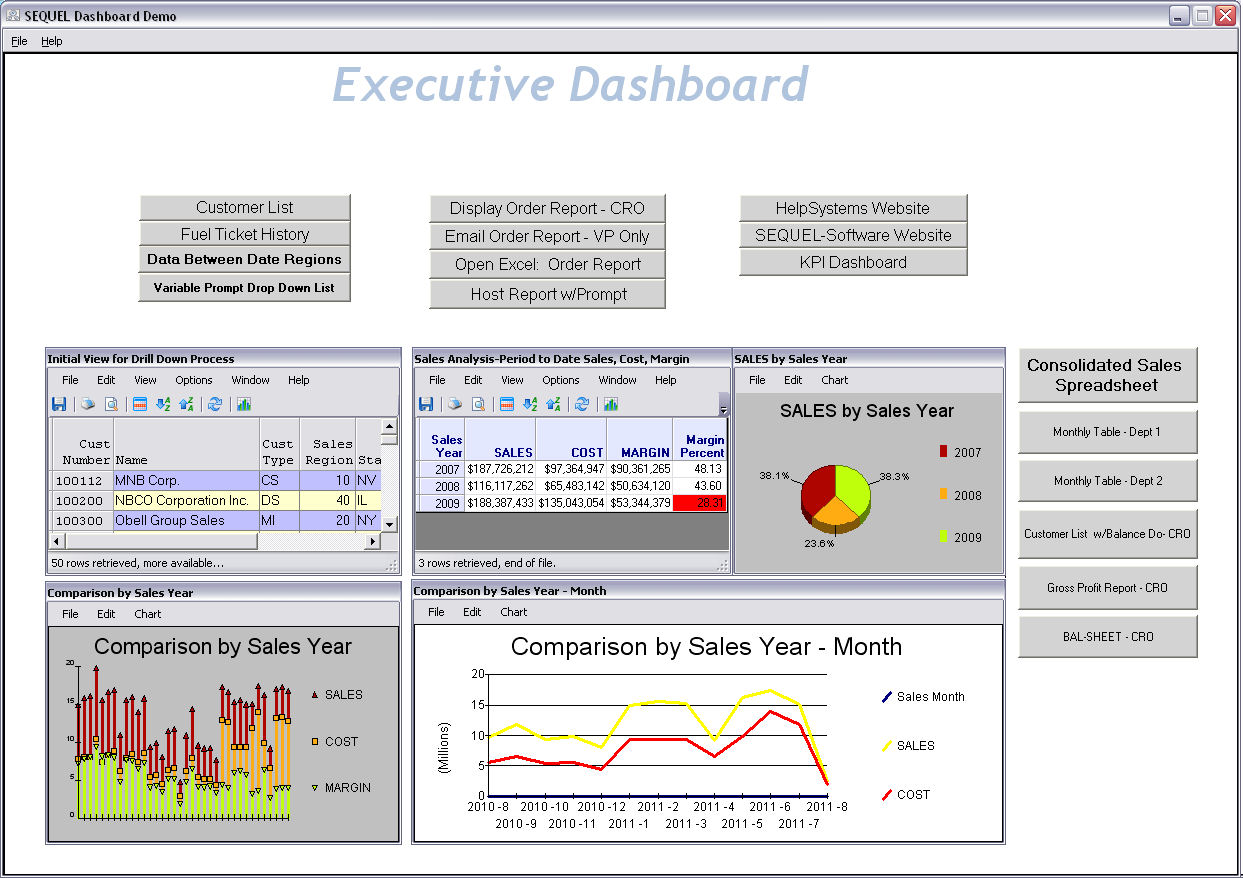
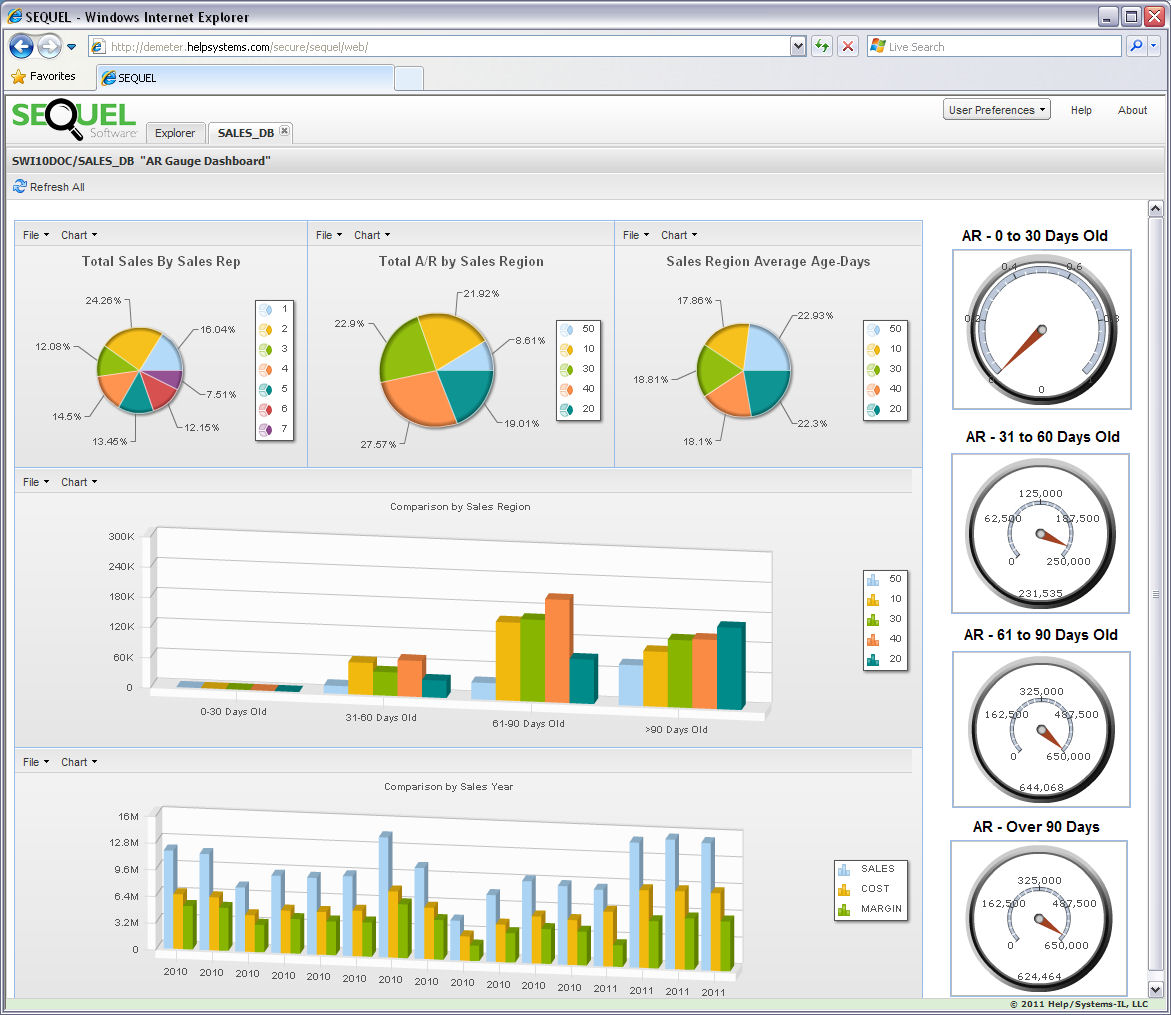
Figure 1: SEQUEL Executive Dashboards provide a variety of visual displays. (Click images to enlarge.)
Analyze Complex Business Information
An Executive Dashboard is the ideal way to display and analyze key IBM i business data—manufacturing, distribution, inventory, or financials. For example, create some SEQUEL financial views and display the results in the dashboard. Then, combine consolidated income statements, balance sheets, graphs, and reports into a single, easy-to-use display. Finally, add your company logo, text, and links to supporting data to customize it.
Using SEQUEL's drill-down capabilities, you can analyze the financial information displayed in the dashboard and see account detail and sales by company or by profit center. With a SEQUEL Executive Dashboard, you can draw a complete picture of your financial status.
Create Custom Dashboards for Your Key Business Indicators
Everyone—executives, non-technical management, and end users—can create Executive Dashboards to view important business metrics from a desktop icon. A SEQUEL Executive Dashboard can contain any combination of the following items:
- SEQUEL view and table results (drill-down capability)
- SEQUEL graphs (drill-down capability)
- Action buttons to launch applications, display different views using run-time prompts, or e-mail reports using ESEND
- Web browser windows
- Windows applications
- Company logo and other graphics files
- Text with custom fonts, colors, size, and style
- Background images and colors
Combine Data from Across Your Entire Enterprise
You can combine data from IBM i, UNIX, and Windows databases on one dashboard to consolidate data across your network. You don't have to transfer IBM i data from your DB2 database to a data warehouse to query it. SEQUEL lets you access DB2, Oracle, MySQL, Microsoft SQL Server, and other JDBC Type-4 databases and makes it easy to connect to them. You create a single point of access to your organization's data so your end users can view data from other systems. SEQUEL Executive Dashboards provide data on demand, no matter where it's stored.
Figure 2: Use an Executive Dashboard to display the information you need.
SEQUEL Web Interface for Zero Client Access
The SEQUEL Web Interface is the easiest, most cost-effective way to access and work with SEQUEL objects and your enterprise data. It lets you use dashboards, views, reports, tables, scripts, and applications from a Web browser. You can create lists of SEQUEL objects, display results, download data to your PC, print, e-mail, and more—without installing PC software.
Figure 3: Display dashboards containing graphics, charts, and gauges.
Put your enterprise data in your decision-makers' hands with SEQUEL. It's easy to use, reliable, and hassle-free. Plus, it offers a support team that you'll love to work with. Call us at 800-328-1000 and ask for a demo or a free 30?day trial. And check out Help/Systems' other offerings in the MC Showcase Buyer's Guide.


 IT managers hoping to find new IBM i talent are discovering that the pool of experienced RPG programmers and operators or administrators with intimate knowledge of the operating system and the applications that run on it is small. This begs the question: How will you manage the platform that supports such a big part of your business? This guide offers strategies and software suggestions to help you plan IT staffing and resources and smooth the transition after your AS/400 talent retires. Read on to learn:
 Business users want new applications now. Market and regulatory pressures require faster application updates and delivery into production. Your IBM i developers may be approaching retirement, and you see no sure way to fill their positions with experienced developers. In addition, you may be caught between maintaining your existing applications and the uncertainty of moving to something new.
LATEST COMMENTS
MC Press Online